
After a hugely positive day for stocks on Thursday, negativity returned to Wall Street. This up and down action underlines how crazy it is to get comfortable about what stocks will do in the short term. So, let’s try to make sense of what we’re seeing right now, so you can position your portfolio for the longer-term play.
This week’s stocks trading underlined how two big forces are determining what’s happening to the value of our portfolio or super balances. On one hand, we have inflation and what the Fed will do with interest rates. On the other hand, there are those wondering about ‘if’ and ‘when’ a recession might come along.
In case you missed it, the yield curve is negative now and a negative yield curve has historically pointed to a recession. That said, it isn’t excessively reliable, despite many commentators ignoring its inconsistency as an indicator.
But it’s not just inflation versus recession readings on their own driving share prices. The market is stressing over whether inflation will remain sticky at lower levels, but still too high for the Fed, which will mean rate rises could continue or remain at high levels for a longer-than-expected time.
Then there’s the question of whether a possible recession next year will be mild or deeper than expected, which of course will have a different impact on profits and share prices. Or there might not be a recession. There’s no clear line of overall consensus on what the short-term future holds.
Another possibility is whether we could end up with a Goldilocks US economy, not too hot for inflation but also not too cold for a recession.
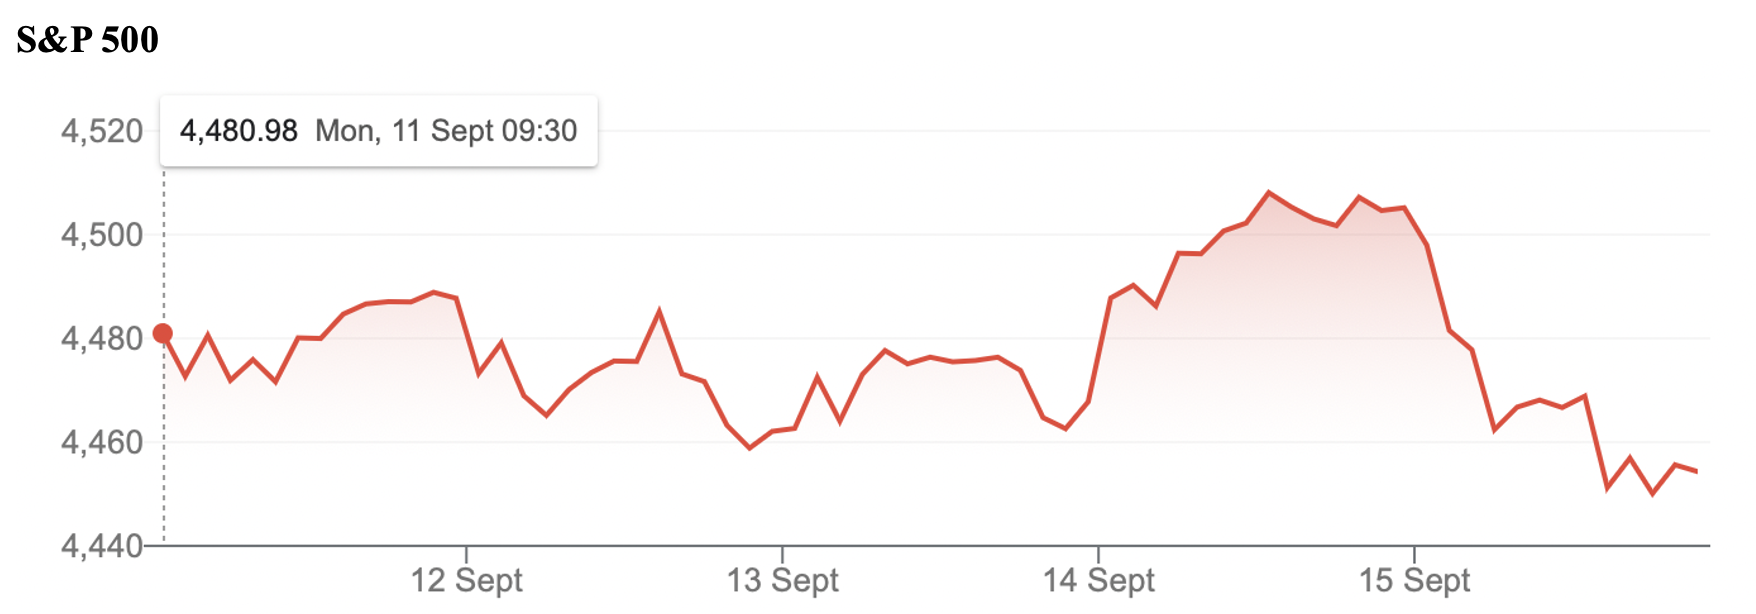
These many different possible economic outcomes with their different implications for stock prices explain this chart for the S&P 500 Index. What you will notice is that US stocks rose on Monday, fell on Tuesday, were flat on Wednesday, boomed on Thursday and slumped on Friday.
Is this a definition of a market with traders, fund managers and investors not having a clue about what’s going on?
Just about all the week’s US economic data came in better than expected, so US bond yields went higher, which can’t make you feel confident that the Federal Reserve is done and dusted with interest rate rises.
On the big watch of the week (i.e., inflation) the CPI was up 0.6% as expected and the Producer Price Index (PPI) was worse than the expected 0.4%. It was up 0.7% for August, but a low 1.6% year-on-year.
However, if you exclude food and energy, the core PPI climbed 0.2%, in line with the estimate. On a 12-month basis, core PPI increased only 2.1%, its lowest annual level since January 2021, and that was pandemic times. Excluding food, energy and trade services, the PPI increased 0.3%.
Remember that lower inflation means the Fed could stop raising rates so that PPI results had to be good for stocks. This followed the more important Consumer Price Index, which rose 0.6% in August and 3.7% from a year ago. Excluding food and energy, core CPI increased 0.3% and 4.3% respectively.
Those monthly numbers without food and inflation are good for stopping the Fed raising rates but the headline CPI’s rise (like the PPI’s) came largely from a big jump in energy prices. The PPI energy index rose 10.5% on the month, spurred by a 20% surge in gasoline prices. So, it’s like the Fed’s rate rises are working to hose down inflation but those pests in OPEC+ by pushing oil prices up are partially screwing up the fight to get inflation down!
It’s no wonder that the market doesn’t know whether to buy or sell stocks!
On other data that talks to recession concerns, industrial production was up this week, the New York Empire manufacturing number rose and US retail sales went up beating expectations. If you add in the implication of these numbers to the jobless claims figures, then the stats aren’t screaming that a recession is coming.
But wait there’s more, and it adds to the confusing picture for anyone trying to guess whether they should be a buyer or seller of stocks. The University of Michigan’s consumer sentiment survey (out overnight) showed one-year inflation expectations dropped to 3.1% in September, which again ties for the lowest reading since January 2021 in pandemic times! Also, the five-year outlook fell to 2.7%, matching its lowest since December 2020.
To the local story and the S&P/ASX 200 was up 1.7% for the week, which is a nice sign for market optimists. However, given what drove US stocks on Friday, our Index is tipped by SPI futures to open down 42 points on Monday. Clearly, we’re in the hands of Wall Street and those indicators and big share players who influence stock prices in the US.
A good local sign was better-than-expected economic data from China (see below) and there were better outlooks for the global economy helping stocks. Not surprisingly, our big miners did well.
Here’s the AFR’s quick summary: “Miners, from gold to lithium and iron ore, were clear outperformers as heavyweights Rio Tinto, BHP and Fortescue Metals rallied on a six-month high for the iron ore price of nearly $US123 ($190) a tonne, the highest level since April based on futures traded in Singapore.
“Rio Tinto climbed 3 per cent to $118.90 and posted the biggest weekly increase since November 2022. BHP Group was up 3.5 per cent to $45.68 and Fortescue 4 per cent to $21.22. It has stormed almost 10 per cent higher this week.”
But history shows Fortescue always moves in big licks, both up and down, because it’s not as ‘blue’ a chip stock as BHP and Rio.
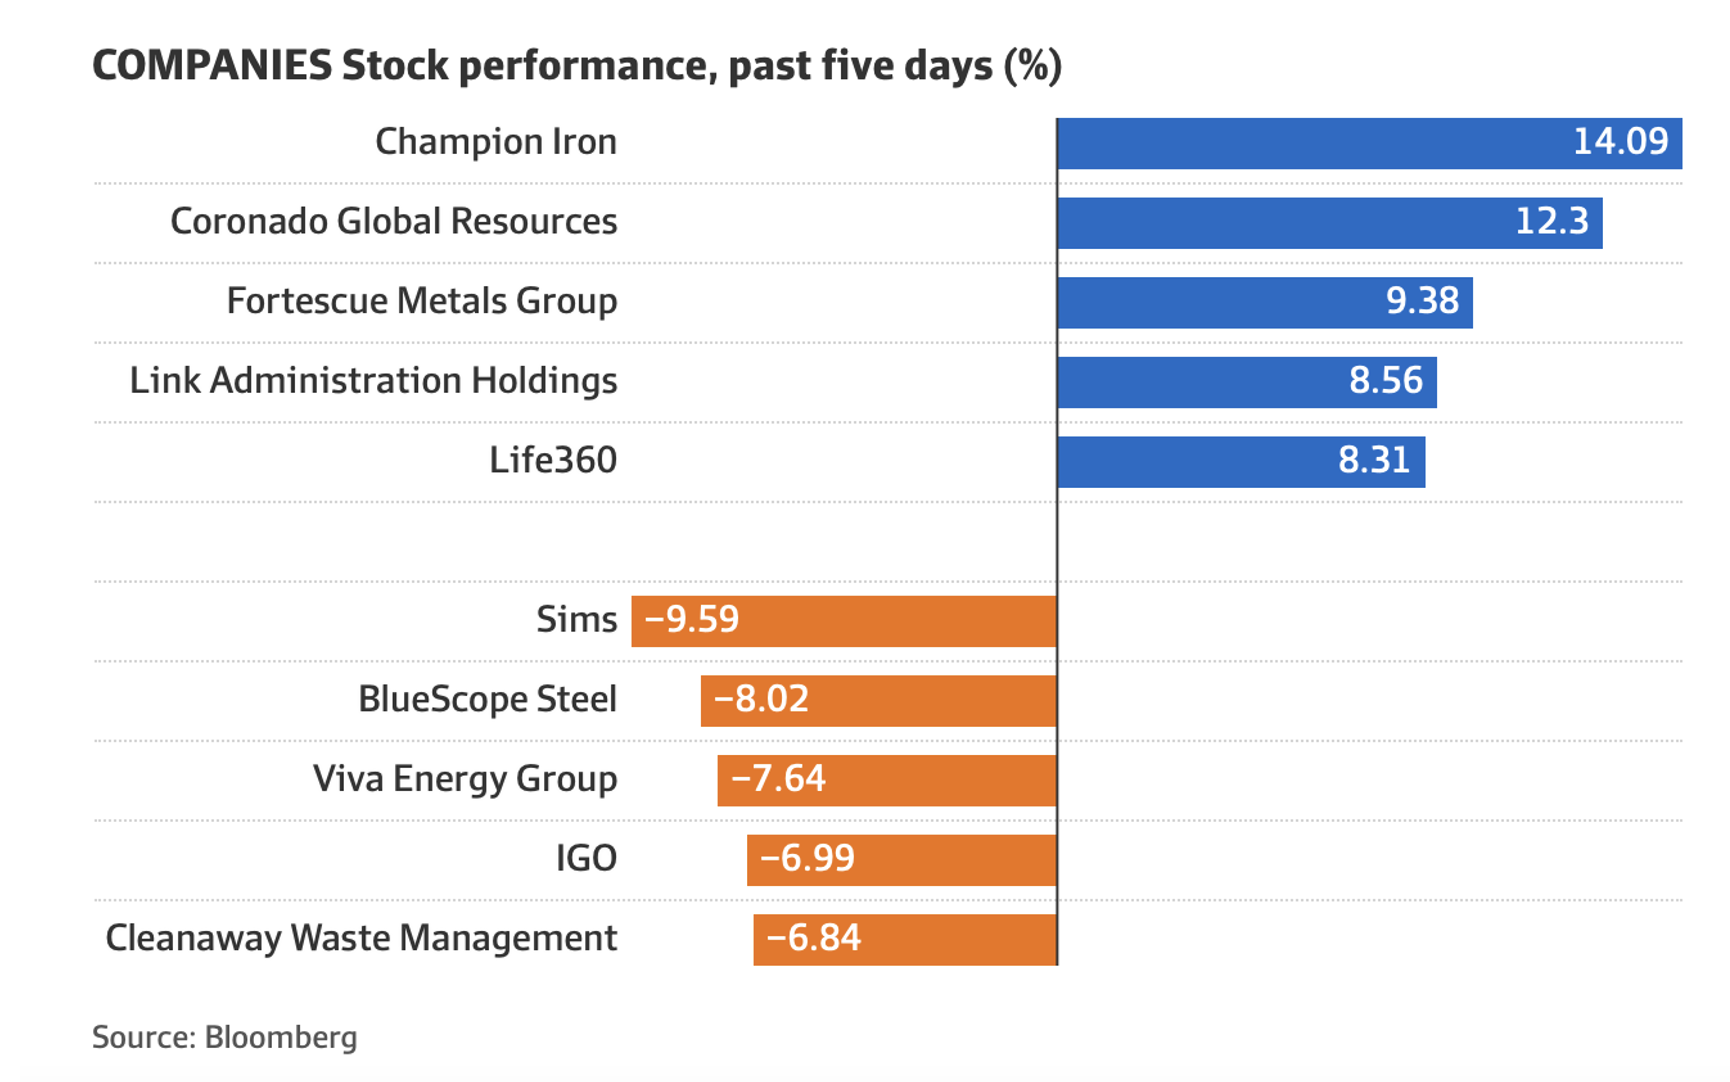
Here are the big winners and losers of the week, thanks to Bloomberg and the AFR:
What I liked
- The unemployment rate was steady at 3.7%. While employment went up, 62,100 were part-time jobs. If they were full-time, the RBA could be worried into another rate rise.
- The rate-sensitive Australian government bond yield fell from session highs of 3.85% immediately after the jobs report to lows near 3.82%.
- Consumer confidence fell by 1.5% in September, as cost‑of‑living pressures remained front of mind for households. This is another reason for the RBA not to raise rates.
- Business confidence rose by 1 point and business conditions increased by 2 points, but this won’t worry the RBA. In fact, this might make the Bank think that a soft landing is likely.
- Labour cost growth eased to 3.2% a quarter in August, down from the 3.7% a quarter pace in July.
- The Albanese Government’s target to build 1.2 million new homes over five years from July 2024 (or 240,000 a year). Hope that’s doable!
- US retail sales growth slowed in August, July sales were revised down and small business optimism remained weak. The US has to show that its economy is slowing or else the Fed will raise rates again.
- Chinese economic data for August was stronger than expected, suggesting that growth may be stabilising. Growth in industrial production, retail sales and credit picked up more than expected, falls in exports and imports slowed and deflation abated.
What I didn’t like
- A surge in global oil prices to above $US90 a barrel (on Saudi and Russian production cuts) and wider refinery margins have pushed Australian petrol prices to near last year’s record highs at over $2 litre. This is bad for inflation and rate cuts.
- US inflation for August rose to 3.7% year-on-year from 3.2%, but a lot of that was because of higher oil prices. Still, I would’ve preferred another drop. Sticky inflation will stall rate cuts expected in 2024.
- The European Central Bank (ECB) hiked their policy rates by 0.25%, taking the main refinancing rate to 4.5% with higher inflation forecasts.
- UK jobs data was weak in July,with another rise in unemployment and fall in job vacancies, but wages growth remained strong at 7.8% year-on-year. This will worry the Bank of England. Economic policy doesn’t seem to be working in the UK.
Are the rate hikes working in Oz?
This from AMP’s Shane Oliver suggests the rate rises are working here: “Leading indicators of jobs growth point to a further slowing ahead. Our Jobs Leading Indicator based on job vacancies and hiring plans points to a sharp slowing in jobs growth to around 1% year-on-year (or 12,000 net new jobs a month). With the surge in immigration driving strong population and hence workforce growth, around 37,000 net new jobs a month are currently required to stop unemployment from rising. Anything below this (absent a fall in participation) will see higher unemployment. We expect unemployment to rise to above 4.5% by the second half of next year. The ongoing evidence of a softening jobs market is consistent with our forecasts that the RBA will leave rates on hold again at its next meeting, although retail sales and inflation data in the next few weeks could also impact that decision.”
The Week in Review
Switzer TV
- Switzer Investing: SwitzerTV Monday 11th September 2023
- Boom Doom Zoom: 14th September 2023
Switzer Report
- Two stocks catering to the longer lifespan megatrend!
- “HOT” stock: Incitec Pivot (IPL)
- Questions of the Week
- 4 out-of-favour stocks and 1 risky ETF
- Has Orora paid too much for European bottle maker Saverglass?
- “HOT” stock: GQG Partners Inc
- 4 global leaders
- Buy, Hold, Sell — What the Brokers Say
Switzer Daily
- Is Tim Gurner right about Aussie workers?
- The mortgage cliff is forcing Aussies to sell their homes
- Tell me lies, Dr Jim, ‘tweet’ little lies
- Aussies dislike Alan Joyce but experts tip the Qantas share price to soar!
- The economy: I see the bad moon a-risin’. I see trouble on the way…
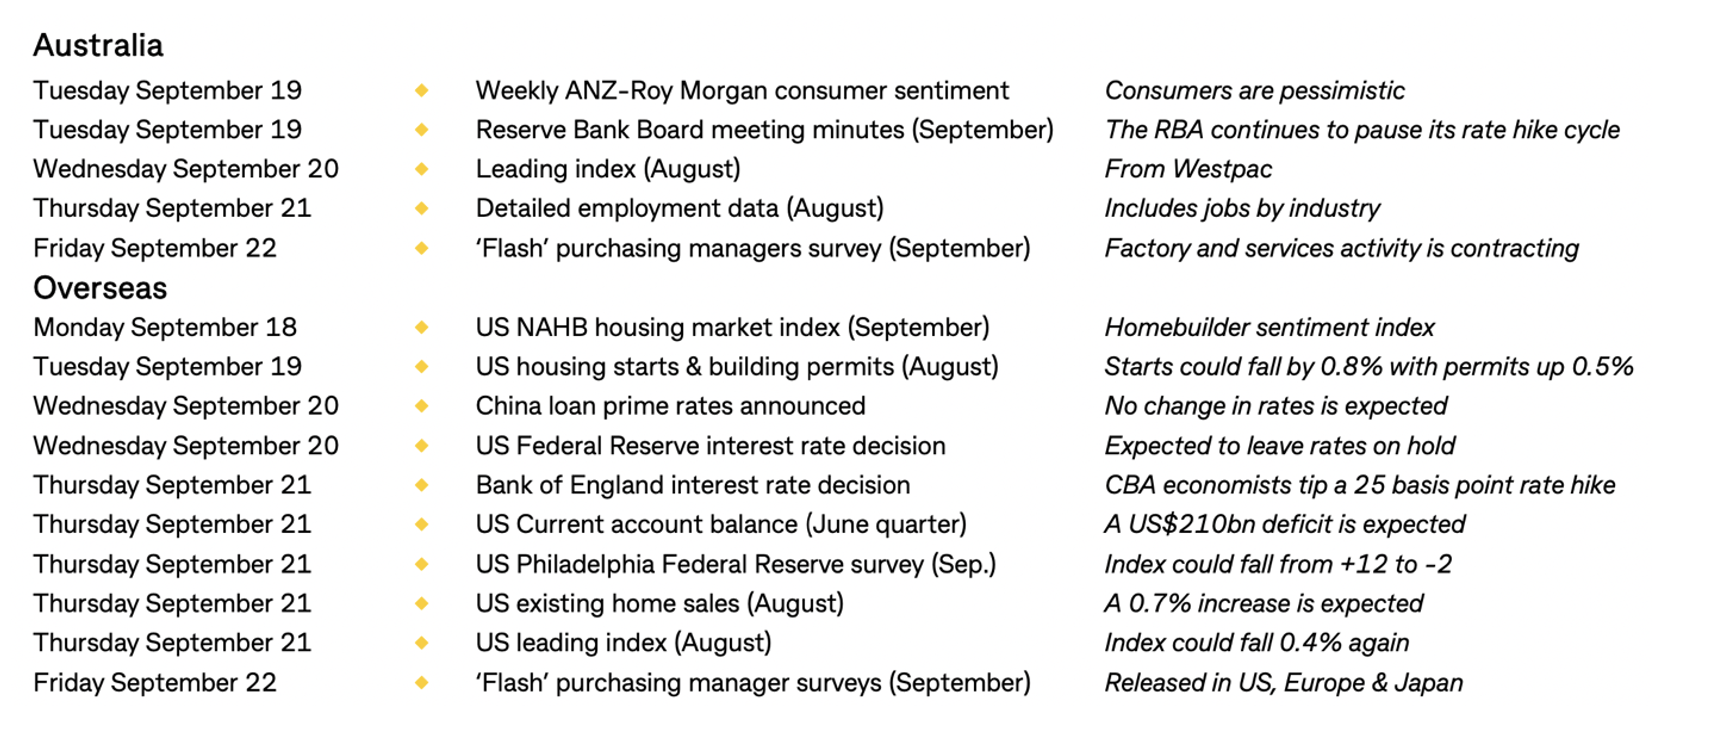
The Week Ahead
Top Stocks — how they fared.
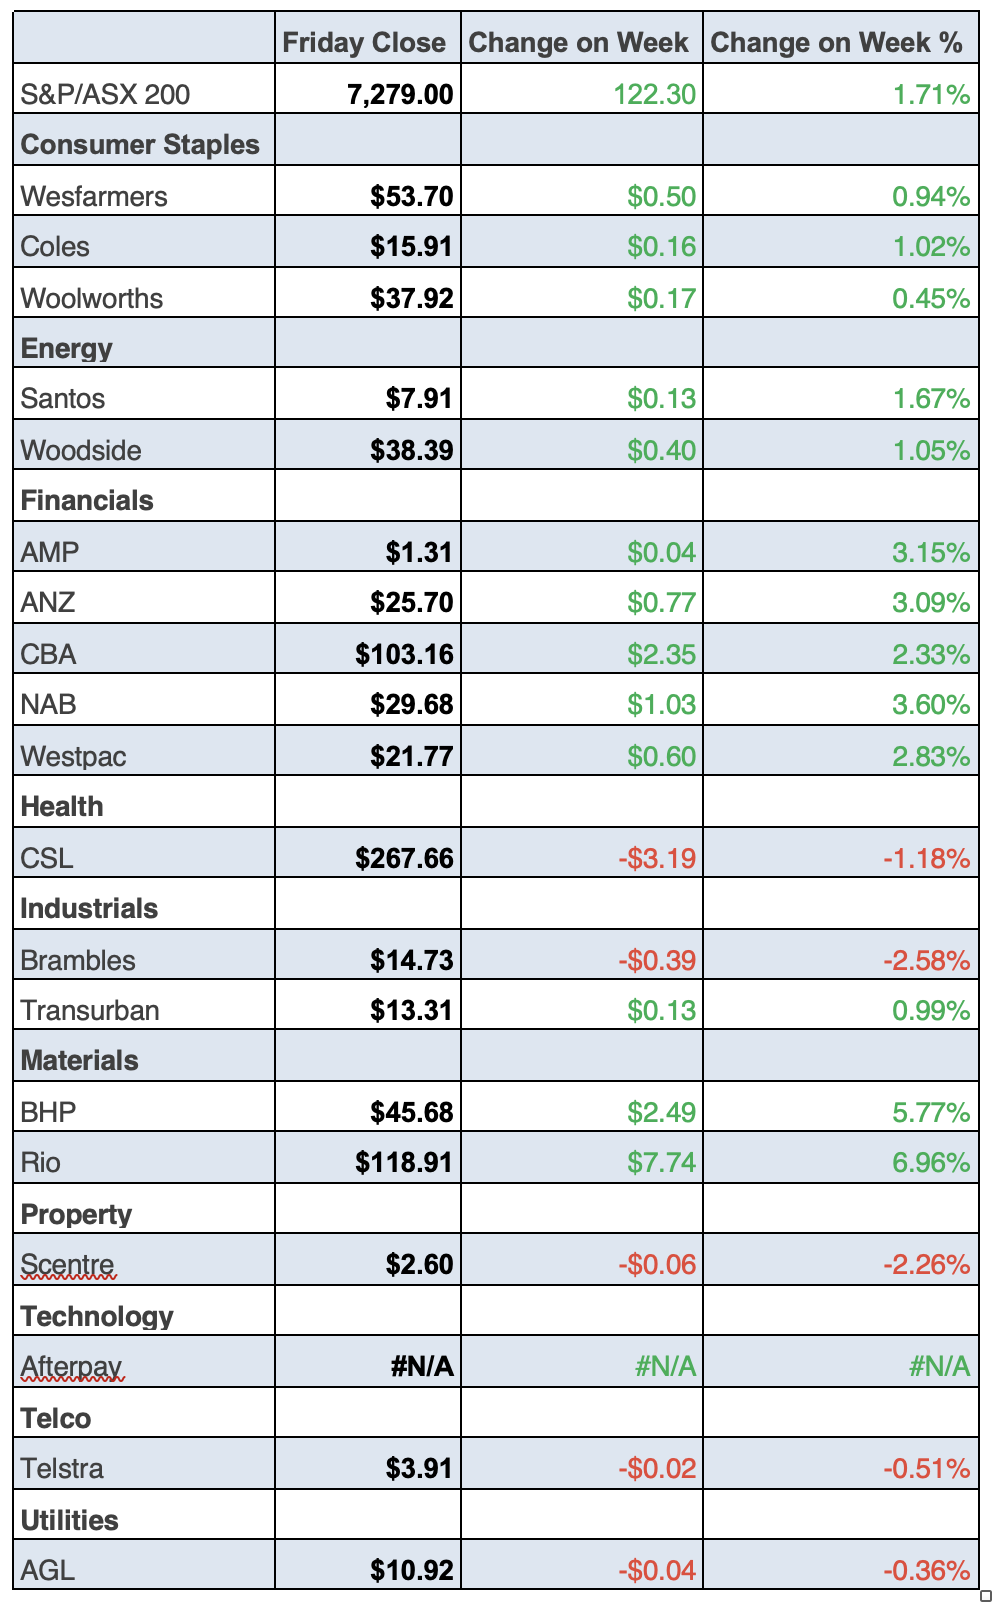
Chart of the Week
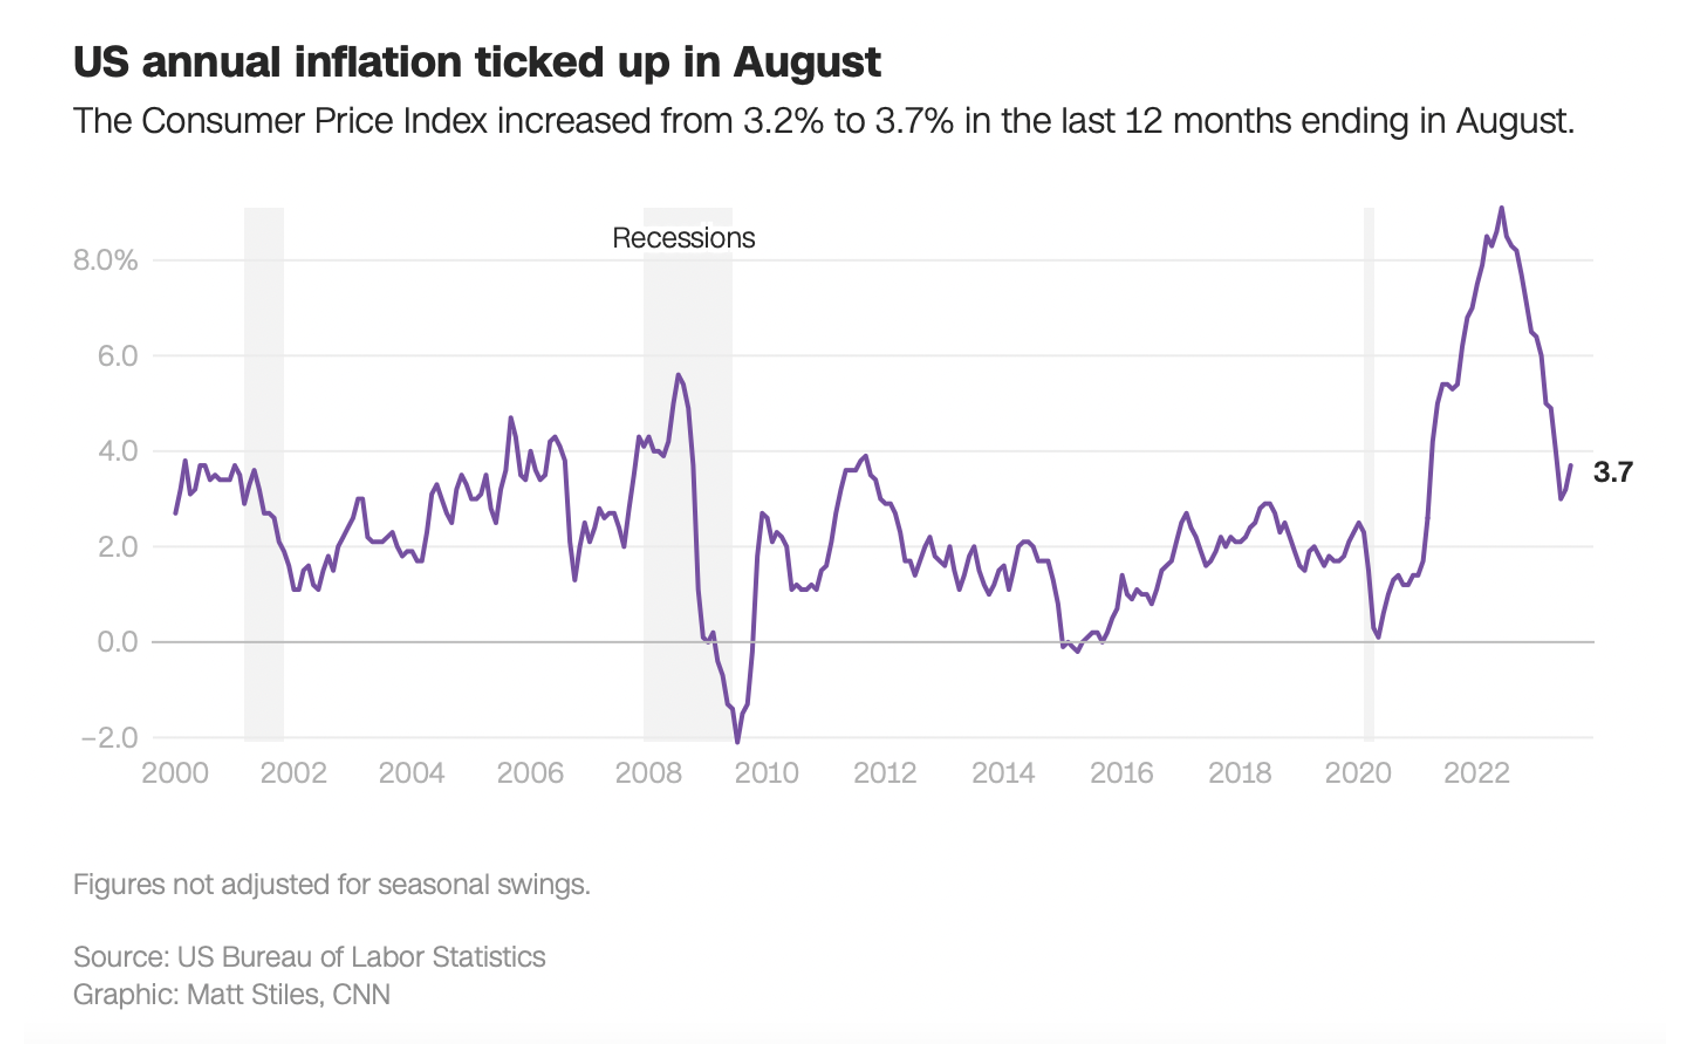
“Looking ahead, easing demand for goods and services, the pass-through from softer home and rent price inflation, and cooling wage growth should lead to further disinflation,” wrote Gregory Daco, chief Economist at EY-Parthenon, in a note reported by CNN.
It also revealed: “Shelter costs, which make up a large chunk of the CPI, rose 0.3% in August from the prior month, the smallest gain since January 2022. San Francisco Fed researchers argued in a recent paper that shelter inflation could turn negative in the second half of 2024. That would help the CPI drift down.”
Stocks Shorted
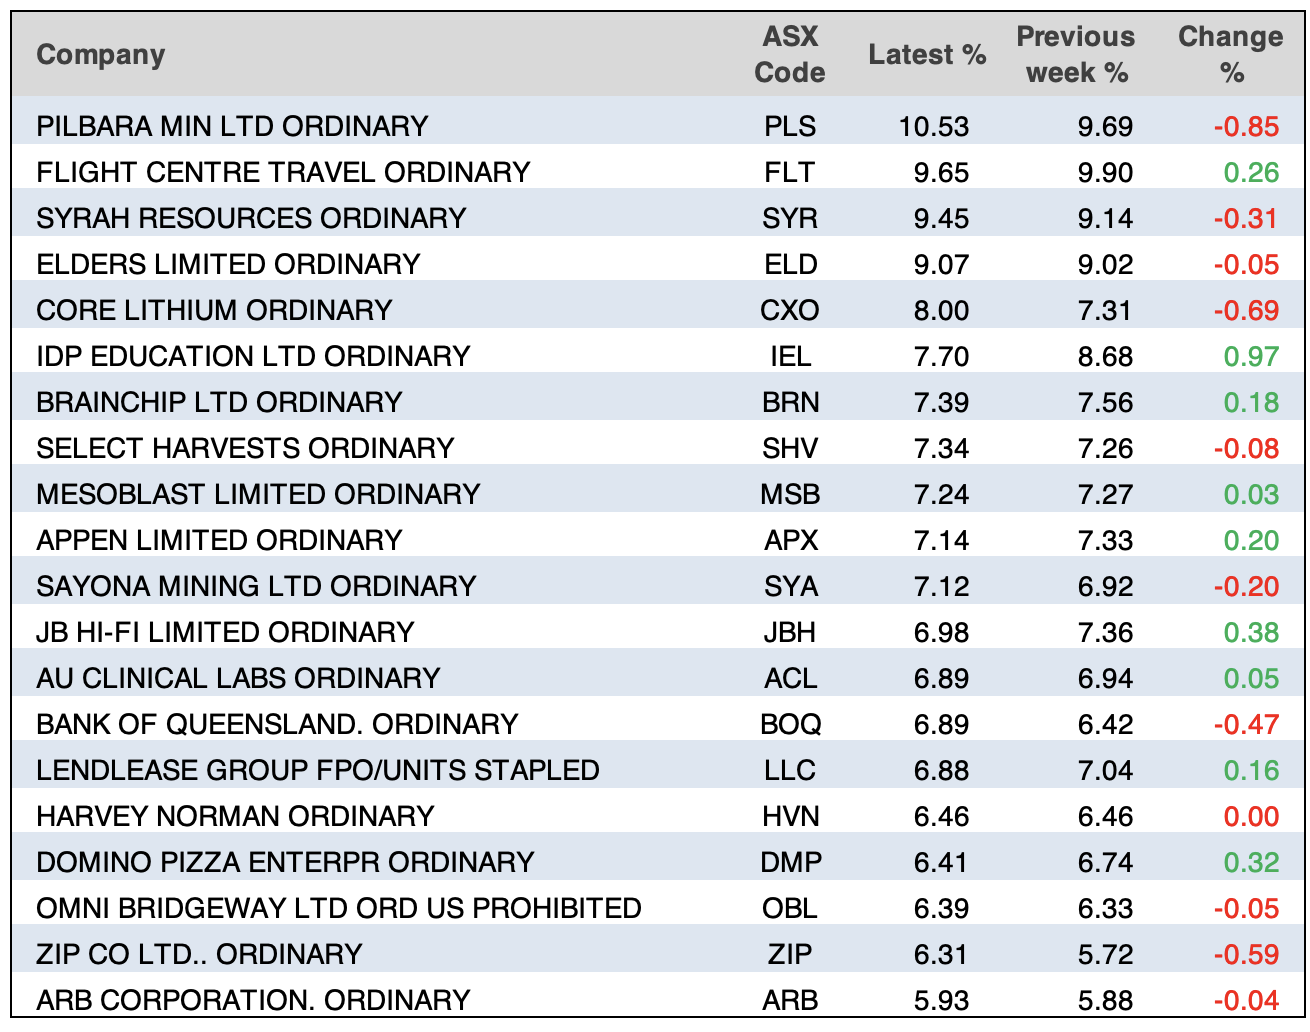
ASIC releases data daily on the major short positions in the market. These are the stocks with the highest proportion of their ordinary shares that have been sold short, which could suggest investors are expecting the price to come down. The table shows how this has changed compared to the week before
Quote of the Week
“The employment growth was driven primarily by part-time, up by 62.1k versus full time of 2.8k. This move will be important to watch given the loss of jobs in July were full time jobs, yet part time jobs drove the recovery. If this trend continues it could be an additional sign of loosening demand for workers.” Belinda Allen Senior Economist CBA.
Disclaimer
Important: This content has been prepared without taking account of the objectives, financial situation or needs of any particular individual. It does not constitute formal advice. Consider the appropriateness of the information in regards to your circumstances.

