

One really important revelation from my years explaining stock market behaviour is that sometimes it can defy logic and sometimes there are multiple forces at work. And this week’s ignoring of the scary implications of Donald Trump’s escalation of the trade war rhetoric was a case in point. Last week, the $US34 billion US tariffs matched by a Chinese ‘return of serve’ didn’t bother the stock market.
Why? Well, both warring parties did what was expected so the factored-in principle applied. However, the upping of the Trump tariff ante to a threat of another $200 billion worth of tariffs on China, and the latter saying it would look at qualitative trade restriction measures, initially brought a negative response in Europe and then on Wall Street. However Asian markets ignored the apparent hotting up of the trade war.
In fact, China’s not overreacting has helped markets cope with the Trump tactic.
I looked at the possible reasons on Friday in my Switzer Daily column and came up with:
- The market doesn’t believe it will happen and that it’s all the breast-beating of a tough guy negotiator, who knows his limits but isn’t prepared to show his cards when he knows he’s bluffing with a good hand rather than a great hand.
- There’s not enough information on what goods and companies will be affected so professionals can’t work out whose companies’ bottom lines will be impacted.
- The fiscal stimulation ahead for the USA will more than offset any potential trade losses.
- The combined positives of good earnings news as reporting season starts again and the solid state of the US economy is offsetting any negatives from the threat of an escalated trade war.
I reckon it’s a combination of all these reasons but “it won’t happen” rates very highly.
Overnight, the big banks overnight (J.P.Morgan, Citigroup and Wells Fargo) haven’t reported as strongly as expected. It should be remembered this show-and-tell season is supposed to come up with a 20% increase in earnings. Even more important will be the combined impression from US company outlook statements.
Despite all this, the S&P 500 broke through the 2800 level for the second time. The high is 2870, which happened in January. And if geopolitical curve balls can be contained, experts (such UBS’s NYSE man on the floor, Art Cashin, who I’ve interviewed when I took my TV show to the Big Apple) think stocks can head higher. (CNBC)
Art thinks a lot of the market believes the $US200 billion tariff play is a part of the Trump negotiation tactics. But if they’re proved wrong, it could give stock markets the jolt that could ruin our great market comeback. Since April 4, we’re up 9% before you throw in dividends and franking, so we have to hope the Trump trade war doesn’t get any hotter.
This week, the S&P/ASX 200 index was down a measly 3.9 points to stop the clock at 6268.4. This wasn’t bad, considering it was a softer week for commodity prices, linked to the impact of tariffs on China. And then Libya informed the oil market it was getting its production act back to normality, which took the oil price down.
Helping us is a stronger greenback and weaker Oz dollar. For over a year or more, I’ve been hoping and writing about our dollar dropping, as something that would help our stock market.
The “unbelievable but I like it story” of the week was Citi upgrading its view on CSL, which beat the $200-level this week. But the US bank now thinks it can see $232! CSL has always been a big tip from my colleague Paul Rickard and I hope you have been persuaded by him over the past few years to go long the stock.
On the subject of exceptional companies, what about A2 Milk? This week we learnt that its EBITDA was 96% higher for the year, with sales up 68%! The company isn’t bullish on itself for 2019, as it invests in great growth strategies, but this is a Kiwi outfit that has an All Blacks winning track record.
On the worry front, Fairfax’s respected journo, Steve Bartholomeusz, has underlined something to watch.
“The copper price, which started sliding a month ago, slumped 3 per cent on the London Metals Exchange on Wednesday night to its lowest level for a year. It’s fallen about 15 per cent in a month.”
Steve gave us an important lesson on Dr Copper, as market-types like to call it.
“Copper’s peculiar status as an early indicator of global economic activity has been earned as a result of studies that have demonstrated the price is a lead indicator of economic conditions,” he explains. “In particular, it is highly correlated to world trade and economic growth in the big three economic regions – China (the world’s biggest consumer of base metals), the US and the European Union.”
Economics, earnings and other important company/stocks stuff aside, the big curve ball for the markets for the week ahead could be the meeting of President Trump with Russia’s boss, Vladimir Putin. What these two fun guys could cook up is anyone’s guess!
What I liked
- The Westpac/Melbourne Institute survey of consumer sentiment index rose by 3.9% to 106.1 in July – the highest level in 4½ years. The index is above its long-term average of 101.4. A reading above 100 denotes optimism.
- The number of dwelling starts rose by 5.2% to 57,112 in the March quarter, driven higher by an 8.8% surge in apartments. Work started on 221,043 new dwellings over the year.
- The number of loans (commitments) by home owners (owner-occupiers) rose by 1.1% in May – the first increase in six months. Loans are down by 2.5% on the year.
- The NAB business conditions index rose from a downwardly-revised +14.0 points (previously +15.1 points) in May to +15.0 points in June. The long-term average is +5.7 points.
- Consumer credit in the US rose by US$24.56 billion (survey: US$12.7 billion) in May, up from a revised US$10.27 billion in April.
- Headline US consumer prices (CPI) rose by 0.1% (survey: +0.2%) to 2.9% over the year to June – the strongest annual growth rate in over six years.
- Chinese exports rose by 11.3% (survey: +10%) over the year to June, down from a 12.6% lift in May. And June imports increased by 14.1% (survey: +20.8%) over the year, lower than the 26% surge in May. China’s imports from Australia rose by 12%.
- Producer prices rose by 4.7% in the year to June (forecast 4.5%), up from 4.1% in the year to May. It was the strongest annual growth rate in six months.
What I didn’t like
- Interest rate rises on home loans by the likes of Macquarie and smaller banks, as overseas funding costs rise. This comes as consumer confidence has turned up nicely so I hope these “rates are rising” headlines don’t kill off the improvement in sentiment.
- The business confidence index fell from an upwardly-revised +6.7 points (previously +6.2 points) in May to +5.7 points in June – the lowest level in 20 months. The long-term average is +6 points.
- Total new lending commitments (housing, personal, commercial and lease finance) fell by 1.4% in May to $67.4 billion. Commitments are down by 1.5% on the year. In trend terms, lending for alterations and additions (renovations) of homes fell to 17-year lows of $310.8 million in May, down 22.6% from the most recent peak of $401.3 million in September last year. The annual decline of 19.9% was the lowest in 7½ years.
A BIG dislike
The bond market is getting close to telling us that a US recession is on the cards. Historically, the yield curve inverts (pointing down to the right in a negative way) because short-term interest rates are higher than long-term rates. I don’t like the fairly reliable history of an inverted yield curve telling us a recession might be ahead but there is no designated time period for when an economic slump happens after the inversion. And there can be false alarms because the economy actually delivers strong outlook indicators after an inversion and long-term rates can sneak up to turn the negative yield curve positive. I know this is technical and possibly even boring but recessions certainly aren’t boring so that’s why I’m adding this here.
Here is an inverted yield curve in theory, with yield or interest rates on the vertical axis and maturity or different time periods for short-term bonds on the left and long-term bond going to the right on the horizontal axis:

Here’s the US yield curve in blue for the Dotcom market crash and recession:

One positive to note is that these inversions of the yield usually come after interest rates have got to much higher levels than we’re seeing nowadays.
The Week in Review:
- Has the top 20 index turned and is it about to enjoy an uptrend? I looked at what the brokers are saying to get an outlook.
- Prefer to invest in Asia? Paul Rickard covered everything you need to know to get started and what you can expect from the year ahead.
- The commodity price rollercoaster can land you in a goldmine or end in fiery disaster. James Dunn reviewed the commodity stocks that you should be paying close attention to.
- Seven West and AGL Energy were our stock picker’s preferences this week, while Ramsay Health Care is not looking good. Find out why!
- In our first Buy, Hold, Sell – what the brokers say, the positive momentum in the Australian market triggered more downgrades than upgrades for ASX-listed stocks. And in our second edition, Bank of Queensland and Integral Diagnostics both got upgrades, while Inghams Group was downgraded.
- Will great expectations be met in the US Q2 reporting season? Charlie Aitken looked at what’s been driving the 2018 Wall Street rally.
- According to Tony Featherstone, believers in retail property trusts need to take a long-term view. Find out his take on Vicinity and Scentre.
- Our Professional’s Pick this week was from Chief investment officer at Munro Partners, Nick Griffin, who explains why Netflix is worth its high valuations.
- And in Questions of the Week, we answered a reader’s query about the importance of diversification when it comes to investing.
Top Stocks – how they fared:

What moved the market?
- US President Trump released a list of 10% tariffs on $200 billion in Chinese goods, making good on his recent threats to escalate a broadening trade war with Beijing.
- There are high hopes for US earning season this year, with analysts predicting companies will report about a 20% jump in second-quarter earnings compared with last year. That’s based on strong US economic trends and Trump’s tax cuts.
- Facebook shares recovered following last week’s Cambridge scandal – driving technology stocks and the Nasdaq to hit a new record high. Amazon, Alphabet, Microsoft and Facebook all closed at record highs on Thursday.
Calls of the week:
- Paul Rickard called ‘Hold’ on BHP, despite the potentially bumpy ride.
- One image has been named ‘the photo that sums up the Nato summit’:

The moment, capturing NATO leaders looking in one direction as Trump looks in another, appears symbolic.
- Two Australian divers who took part in the recuse of the youth soccer team in Thailand have been called national heroes by PM Malcolm Turnbull. Adelaide anaesthetist Dr Richard Harris, who was the last to exit the cave, was tasked with giving the medical all clear for each evacuation. Dr Harris and his diving partner Craig Challen have rebutted the title, calling themselves ‘nobodies.’
- ACCC Chairman Rod Simms made the call to put a limit on 20% of the market concentration on any power generating operator in any one state.
The Week Ahead:
Australia
Monday July 16 — Tourist arrivals (May)
Tuesday July 17 — Reserve Bank Board minutes
Tuesday July 17 — Weekly consumer confidence
Thursday July 19 — Employment/Unemployment (June)
Friday July 20 — CBA Business Sales index (June)
Overseas
Monday July 16 — China economic growth (June quarter)
Monday July 16 — China activity data (June)
Monday July 16 — US New York Fed purchasing managers (July)
Monday July 16 — US Retail sales (June)
Tuesday July 17 — China House prices (June)
Tuesday July 17 — US Industrial production (June)
Tuesday July 17 — US NAHB housing market index (July)
Wednesday July 18 — US Federal Reserve Beige Book (June)
Wednesday July 18 — US Housing starts (June)
Thursday July 19 — US Philadelphia Federal Reserve index (July)
Thursday July 19 — US Leading index (June)
Food for thought:
“Opportunity is missed by most people because it is dressed in overalls and looks like work.” – Thomas A. Edison
Stocks shorted:
ASIC releases data daily on the major short positions in the market. These are the stocks with the highest proportion of their ordinary shares that have been sold short, which could suggest investors are expecting the price to come down. The table shows how this has changed compared to the week before.

Chart of the week:
Sales of cameras (1977-2017) v iPhones (2007-2017)
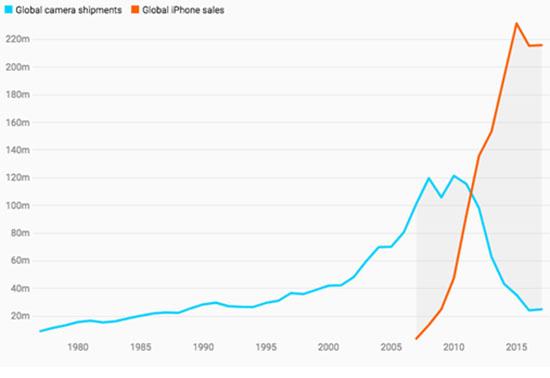
(* iPhone sales calculated from quarterly sales by calendar year)
Source: ABC News / Camera & Imaging Products Assoc / Apple Inc
Top 5 most clicked:
- Is it time to get on board these top 20 stocks? – Peter Switzer
- Investing in Asia – the how and the what – Paul Rickard
- Buy, Hold, Sell – what the brokers say – Rudi Filapek-Vandyck
- Commodity stocks you can’t ignore this FY – James Dunn
- US Q2 reporting season preview – will great expectations be met? – Charlie Aitken
Recent Switzer Super Reports:
- Monday 9th July: Asia investing
- Thursday 12th July: Great expectations
Important: This content has been prepared without taking account of the objectives, financial situation or needs of any particular individual. It does not constitute formal advice. Consider the appropriateness of the information in regards to your circumstances.