September silliness or maybe sensibleness continued overnight with Wall Street succumbing to negativity again, with big tech most out of favour. The usual suspects have been cited for the sell off, with Delta strain concerns mixing with potential Fed actions and the fact that September is a shocker for stocks.
On average, September has been the weakest month of the year for US and Australian shares over the last 35 years!
By the way, Friday was also the quadruple witching hour when the expiry of stock index futures, stock index options, stock options and single-stock futures all lead to significant stock price reactions. “The US share market has fallen five of the last 10 Septembers and the Australian share market has fallen seven of the last 10 Septembers,” AMP Capital’s Shane Oliver told me. “So far the direction setting US share market has found support at its 50-day moving average but the key risks relate to coronavirus, central banks slowing stimulus, the US debt ceiling, the passage of Biden’s remaining stimulus and tax hikes, global supply constraints and inflation, and the slowing Chinese economy with credit risks around the Evergrande Group.”
S&P 500

Does anyone need another reason for an S&P 500 sell off? Well, this is another and the chart above shows it. Not only has the US stock market index rebounded over 90% since the Coronavirus crash, it’s up 31% from its all-time high before the market crashed!
A sell off is overdue and the fact that the S&P 500 Index is only down 2.2% tells you that this isn’t terrible stuff, yet. You know I’ve been telling you that a pullback was on the cards and Shane’s list of reasons to sell off can’t be easily ignored, but in the fullness of time, vaccinations, government stimulus and low interest rates will take stocks higher as a more normal world appears as we get more into 2022.
If it doesn’t, then stocks will simply fall until that normalcy does show up. After that, we will worry about eventual rising interest rates and when the mountain of debt will weigh down on economic growth, corporate profitability and then stock prices. And alas, of course, what China is up to will become an increasing concern both politically and economically.
But that’s down the track and more a concern for 2023 or 2024. As Shane argues, the list of negatives outlined above should explain near-term weakness. “However, we would see this as just a correction, as the likely continuation of the economic recovery beyond near term interruptions, plus vaccines ultimately allowing a more sustained reopening and tight monetary policy being a long way off, all augurs well for shares over the next 12 months.”
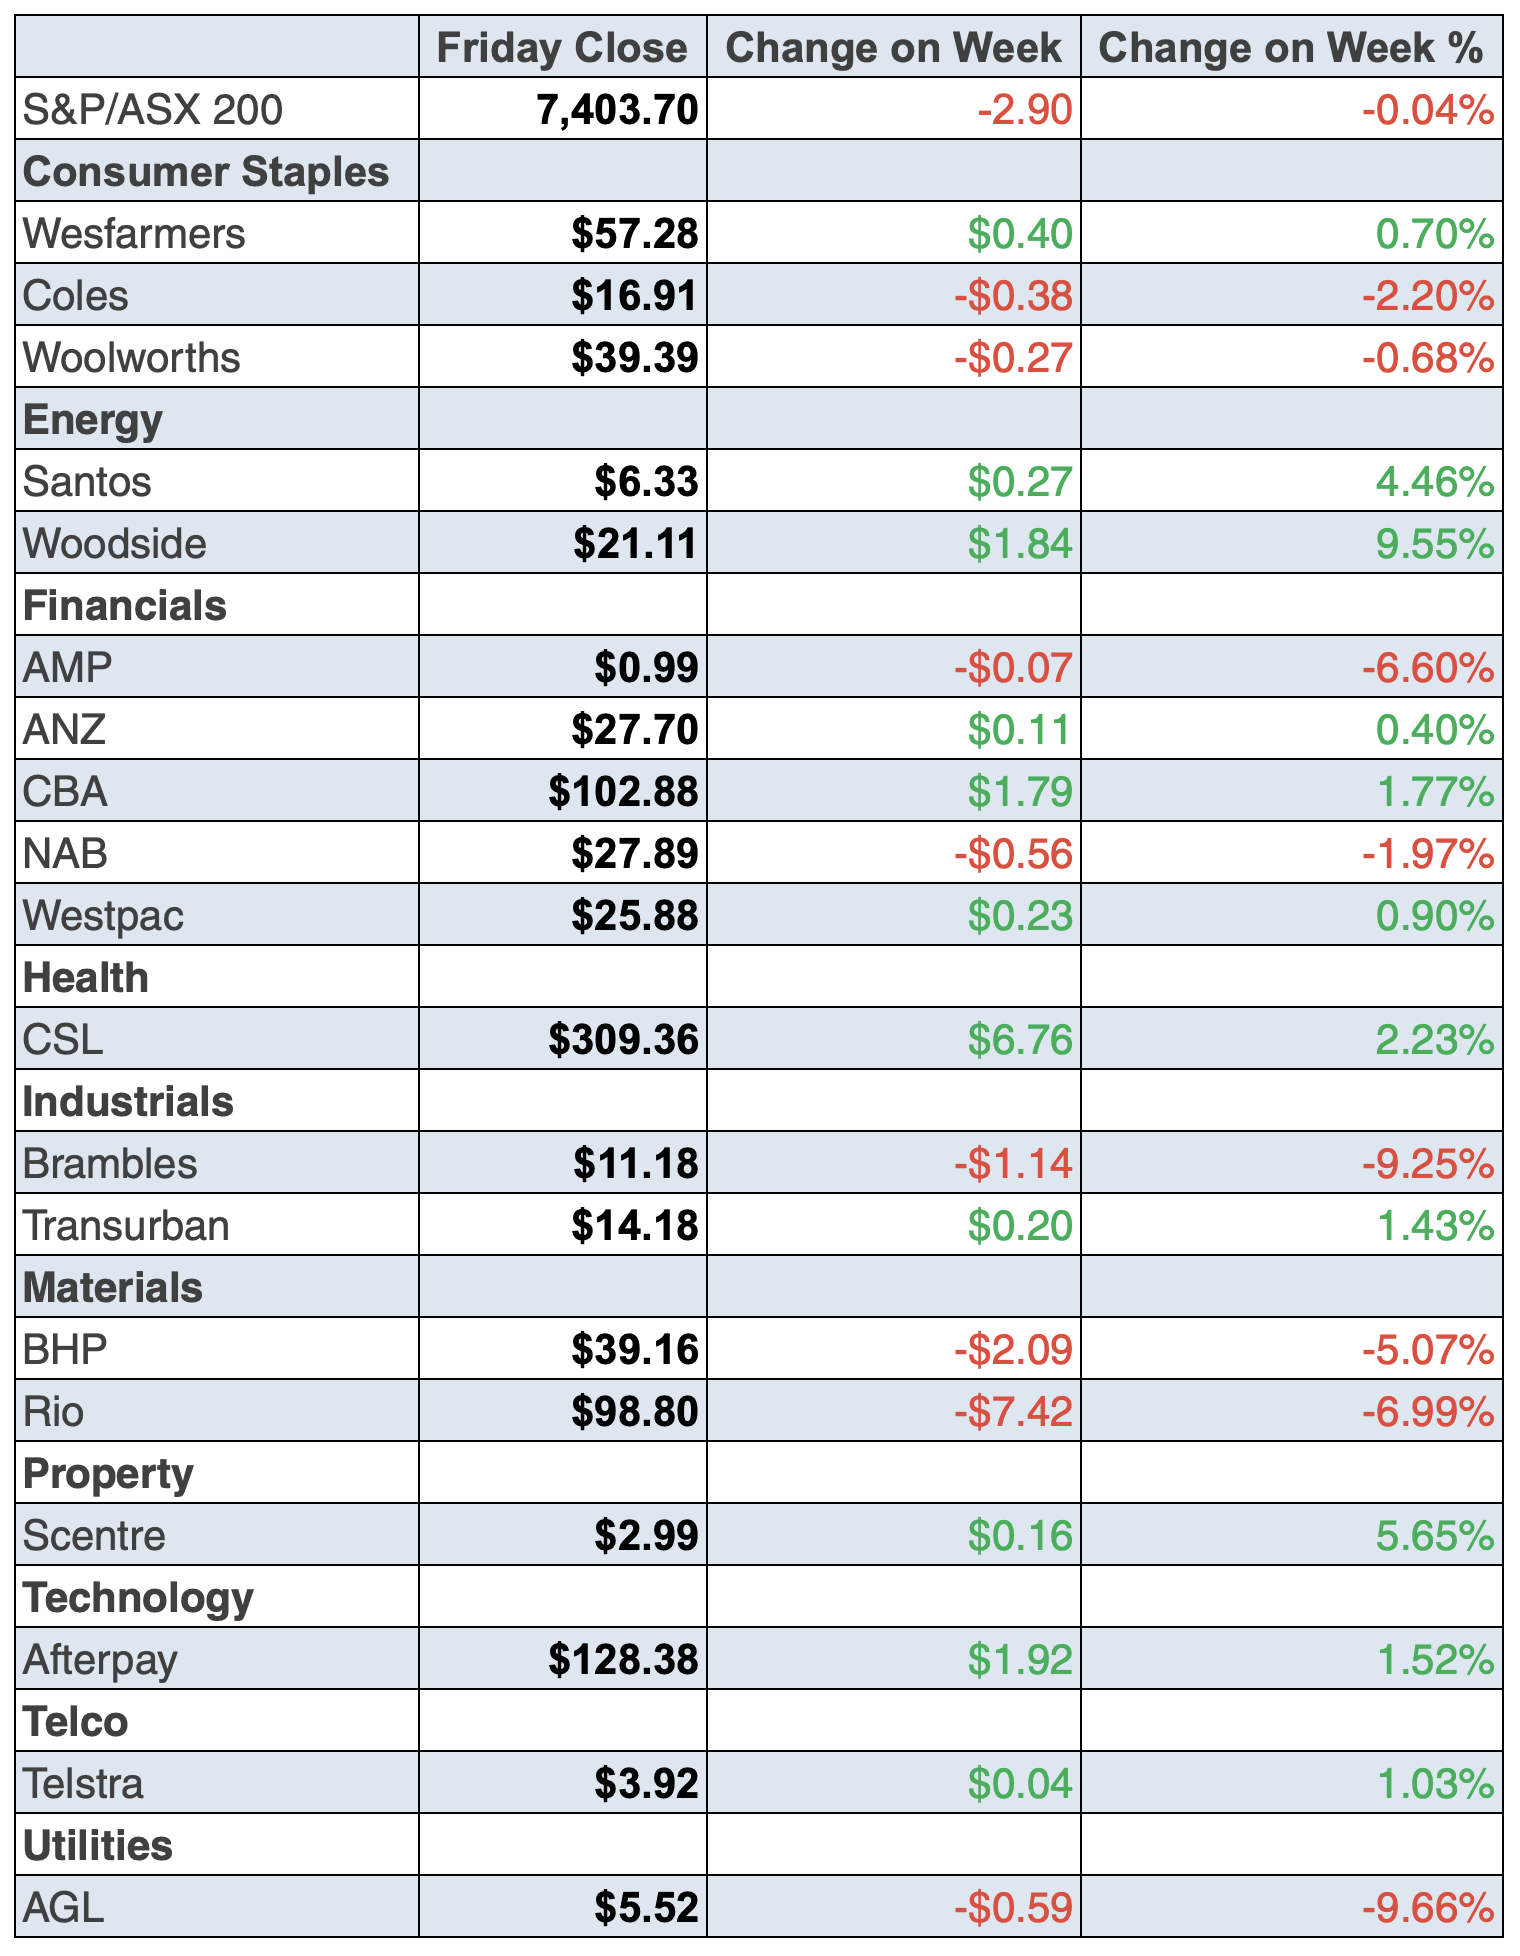
To the local story and the S&P/ASX 200 fell 2.9 points for the week but it felt worse, with Friday shedding 56 points (or 0.76%) with iron ore miners copping it as the iron ore price tumbled 18%. The Index finished at 7403.7.
For the week, BHP lost 5.07% to $39.16, Rio 6.99% to $98.80 and Fortescue 16.42% to $15.27! Ooh ah!
Here’s the chart for Bloomberg winners and losers for the week.

This looks like an overreaction and the market can do that, so I’ll wait until I declare a “buying opportunity”. But I am glad to see at long last Woodside went for a rise on a bullish outlook for the oil price, thanks to OPEC forecasts. Also good to see Altium and WiseTech kick in to show tech stocks aren’t dead and buried.
Surely Appen one day will surprise us and deliver on its promise!
Meanwhile, Qantas continues to fly high, up 3.94% for the week to $5.53 and nothing stops Macquarie with a rise of 3.41% for the week to $180.17.
And again, Pilbara Minerals continues to shine, up 11.71% for the week on more good news from this lithium player.
What I liked
- The Westpac-Melbourne Institute Index of Consumer Sentiment rose by 2% to 106.2 in September. In the latest survey, 28.3% of respondents said the ‘wisest place for savings’ was ‘in the bank,’ with 18% preferring to ‘pay down debt’. And 10.9% of consumers now regard real estate as the ‘wisest’ place for savings.
- The weekly ANZ-Roy Morgan consumer confidence rating rose by 3.1% – the most in 22 weeks – to an 8-week high of 103.1 (long-run average 112.5 since 1990). Sentiment surged 10.6% in Sydney and lifted by 6.2% in Victoria, but was down 3.2% in Queensland. (I like it but I can’t easily explain it!)
- The national unemployment rate fell from 4.6% to a 12½-year low of 4.5% in August. The fall is psychologically good, though surprising, and is explained by the fall in the participation rate but I like it because it has suppressed bad media headlines.
- CBA Group economists estimate that Aussies have accrued $155 billion in excess savings over and above what they would normally save during the pandemic. By the end of 2021, this is likely to exceed $200 billion, (or 10%) of gross domestic product (GDP). Once lockdowns end in NSW, Victoria and the ACT, consumer spending could lift sharply as confidence improves when government restrictions are eased. And consumers will have money to spend!
- CommSec estimates that over $41 billion in dividends will be paid in coming weeks. In the interim reporting season that ended in February, $25.8 billion was paid to shareholders. Payouts in the August 2020 reporting season were $21.6 billion.
- The US consumer price index (CPI) rose 0.3% in August to be up 5.3% on a year ago (survey: 5.3%). It’s big but it is falling, which is we need to see if you want to believe that post-lockdown high inflation rates are only temporary.
- The CommSec index of luxury new vehicle sales rose to a 3-month high in August (and second highest in 33 months) – an annual total of 92,177 vehicles.
- OPEC predicted stronger demand for crude oil, which should be a good news predictor of global economic growth ahead.
- The Philadelphia Fed manufacturing index lifted from 19.4 to 30.7 in September (survey: 19) and the Empire State manufacturing index lifted from 18.3 to 34.3 in September (survey: 17.9), which suggests the US is opening up.
What I didn’t like
- Employment fell by 146,300 in August after rising by 3,100 in July. Full-time jobs fell by 68,000 and part-time jobs fell by 78,200. The participation rate fell from 66% to 65.2%.
- China’s retail sales expanded at a slow 2.5% annual rate in August (consensus: 7%), the slowest pace in 11 months. Industrial production grew at a 5.3% annual rate in August (consensus: 5.8%).
- Default talk about China’s big property firm called Evergrande. That could be a curve ball for debt markets that are always hard to comprehend.
The chart and trend to watch

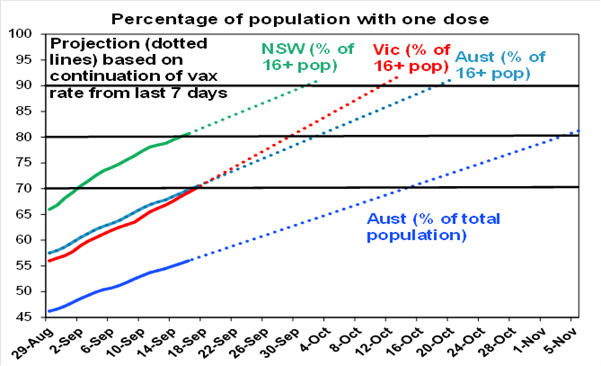
Shane Oliver has shown us the most important trends to watch in the chart above. “On the basis of this projection, the following table shows roughly when key double dose vaccination target dates will be met based on the current lag between 1st and 2nd doses,” he explained. “NSW will hit the 70% of adults target around 7th October, Victoria around 4th November (although I think it will speed up from here) and Australia on average around 27th October. At the current rate NSW could hit 90% of adults with a single dose by 2nd October with 2 doses 38 days later – given the risks this is closer to what we should be aiming for!”
Conclusion? November and December will be good for the reopening of the economy, businesses and the job market. And call me a stock market junkie but share prices should move ahead of these targets being hit, which is why I expect a pullback of stocks rather than a correction (a 10%+ fall in the market index) or a crash, which is a 20% or more collapse.
You have to love what that chart tells you, even if we have to deal with stock market volatility/negativity until sometime in October.
The week in review:
- Here’s my answer to the question: should I buy BHP (BHP), Rio Tinto (RIO) or Fortescue (FMG) at these current share prices?
- Paul Rickard wrote that the $2 billion off-market share buyback from Woolworths (WOW) is a “no brainer” for some shareholders.
- James Dunn put forward this list of five stocks trading either under 50 cents or in the 50s: Magnis Energy Technologies, (MNS) Alcidion (ALC), Imugene (IMU), XRF Scientific (XRF) and Lindsay Australia (LAU).
- Tony Featherstone said these three stocks will benefit from a strong recovery in spending by teenagers once lockdowns end: Universal Store Holdings (UNI), Lovisa Holdings (LOV) and Accent Group (AX1).
- For our “HOT” stocks this week, Shih Thin Wong from Prime Value Asset Management chose Alliance Aviation (AQZ), Raymond Chan from Morgans highlighted Aurizon (AZJ) and Michael Gable from Fairmont Equities selected Pilbara Minerals (PLS).
- In Buy, Hold, Sell – What the Brokers Say this week, there were 8 upgrades and 8 downgrades in the first edition, and in the second edition there were 2 upgrades and 4 downgrades.
- And in Questions of the Week, Paul Rickard answered questions from subscribers about the number of stocks to hold in your portfolio, three US ‘blue chip’ stocks to buy for long-term value, Magellan Financial Group (MFG) and ASX-listed lithium stocks including Orocobre (ORE), Mineral Resources (MIN), Pilbara Minerals (PLS) and IGO (IGO).
Our videos of the week:
- Boom! Doom! Zoom! | September 16, 2021
- We continue our hunt for value stocks: HUB, ILU, BAP, RHC, BHP & more! | Switzer Investing
- Is it too late to buy QAN, WEB, FLT & CTD + what stock did Charlie Aitken add to his OS fund? | Switzer Investing
Top Stocks – how they fared:

The Week Ahead:
Australia
Tuesday September 21 – CBA Household Spending Intentions (Aug.)
Tuesday September 21 – Weekly consumer sentiment index (Sep. 19)
Tuesday September 21 – Reserve Bank Board meeting minutes
Wednesday September 22 – Reserve Bank official speech
Wednesday September 22 – Skilled job vacancies (August)
Thursday September 23 – Markit purchasing managers (September)
Thursday September 23 – Weekly payroll jobs & wages (August 28)
Thursday September 23 – Finance & Wealth (June quarter)
Thursday September 23 – Detailed labour force (August)
Overseas
Monday September 20 – US NAHB housing market index (Sep.)
Tuesday September 21 – US Housing starts (August)
Tuesday September 21 – US Building permits (August)
Tuesday September 21 – US Current account balance (June quarter)
September 21-22 – US Federal Reserve meeting
Wednesday September 22 – China 1- & 5-year loan prime rates
Wednesday September 22 – US Existing home sales (August)
Thursday September 23 – US Kansas City Fed manufacturing (Aug.)
Thursday September 23 – US Conference Board leading index (Aug.)
Thursday September 23 – Markit Purchasing managers index (Sep.)
Friday September 24 – US Federal Reserve Chair Powell speech
Friday September 24 – US New home sales (August)
Food for thought:
“Riches begin in the form of thought! The amount is limited only by the person in whose mind the thought is put into motion.” – Napoleon Hill
Stocks shorted:
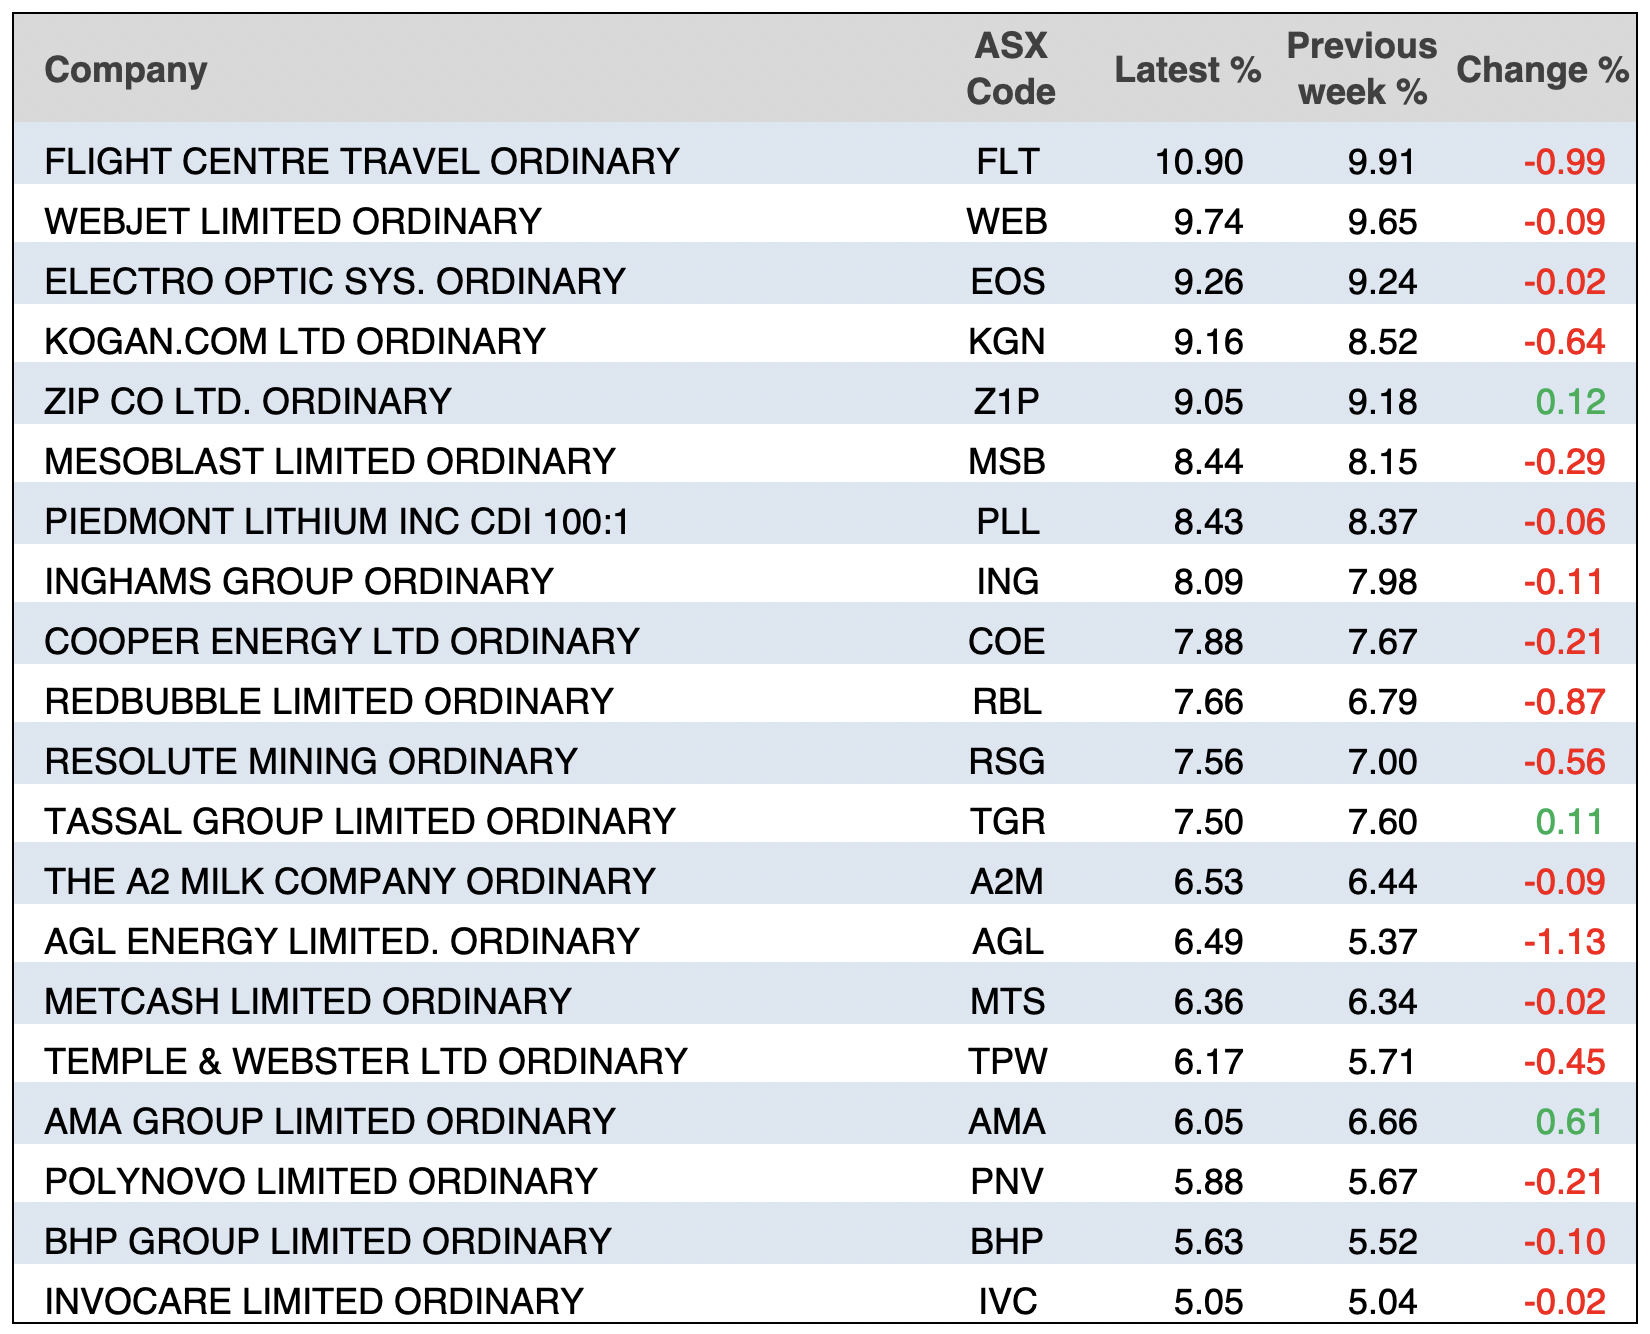
ASIC releases data daily on the major short positions in the market. These are the stocks with the highest proportion of their ordinary shares that have been sold short, which could suggest investors are expecting the price to come down. The table shows how this has changed compared to the week before.

Chart of the week:
The following chart from s tracks the growth of Apple’s revenue from US$5.36 billion in 2001 to $274.5 billion in 2020 along with major product launches for the company:

Top 5 most clicked:
- Should you buy BHP, FMG and Rio at these current prices? – Peter Switzer
- 5 stocks under 50 cents – James Dunn
- Woolworths buyback will “WOW” some shareholders – Paul Rickard
- And the winners are: Casual clothing & inexpensive jewellery stocks – Tony Featherstone
- Questions of the Week – Paul Rickard
Recent Switzer Reports:
- Monday 13 September: Should you buy BHP, FMG and Rio at these current prices?
- Thursday 16 September: 3 stocks to benefit from an expected strong recovery in spending by teenagers
Important: This content has been prepared without taking account of the objectives, financial situation or needs of any particular individual. It does not constitute formal advice. Consider the appropriateness of the information in regards to your circumstances.

