

An analysis of the share price movement of three of Australia’s biggest companies and the ASX200 index reveals that technically, the Australian bourse is not shooting the lights out. However, many small to mid-cap resource stocks have been, so there is opportunity in our market.
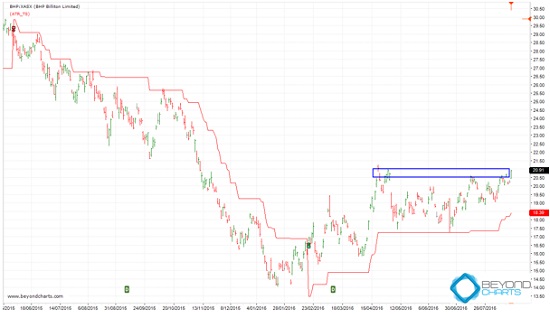
Starting with BHP, its share price movement is showing more promise than it has for some time. BHP has fallen over 68% from over $45 in April 2011 to a low of $14.06 in late January this year. The chart shows most of this fall from $30 in May 2015.
Technically, BHP is now looking quite solid with strong support between $17.40 and $17.80, which is around the trailing red line below its current price. Yesterday’s move to a new three-month high is significant as BHP seeks to rise above its April 2016 close and the overhead resistance zone between $20.50 and $21.00, shown by the blue rectangle.
 Source: Beyond Charts
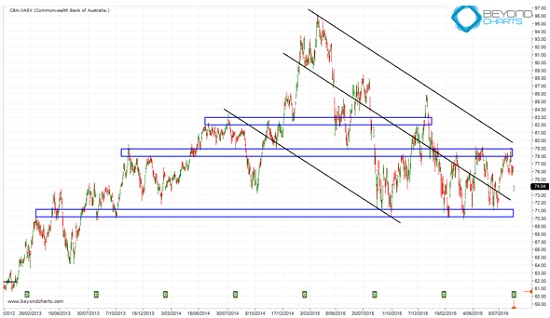
The next chart shows that CBA’s share price is not faring as well as BHP’s. Which one had the bumper profit and which the huge fall in profit?
CBA’s share price is stuck in a down-trending channel demarcated by the black trend lines. Any reversal out of this downward channel will require as a first step a break above the upper channel line. In the short-term it appears that CBA will head lower towards the median line and the lowest blue rectangle, which is a very strong support zone between $70 and $71 below the current price of CBA.
If CBA’s share price falls below this support zone, watch out! It could fall towards the lower black channel line to test its pre-GFC high in the low $60’s! The analysis shows that this is a low probability outcome at this stage.
 Source: Beyond Charts
Telstra is another big Australian that is suffering a price move within a down trending channel. Analysis shows that this channel could last a few more months. In the short term, if the price falls below the median line of the channel then expect a move towards the lower support zone between $4.80 and $5.
Like CBA, a breakout above the upper channel line is required to reverse this long-term down trend, which in hindsight started in February 2015.
 Source: Beyond Charts
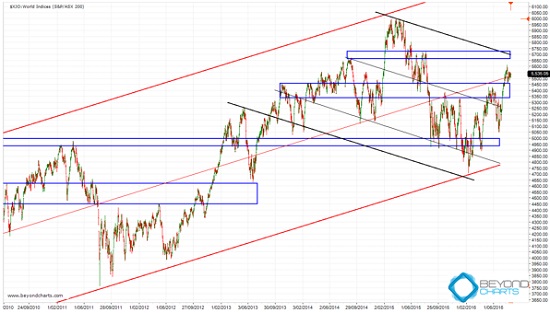
The last chart is the ASX200. Since my last analysis report on the ASX200, it has moved above the middle resistance zone which has now become a support zone. A fall below this zone will break confidence of the ASX200 moving higher possibly until after the annual September/October market weakness.
The ASX200 is still in a downward-trending channel and will remain in one until it breaks above the upper down trending black channel line, which now coincides with uppermost resistance zone between 5660 and 5720. Needless to say that a break above both these will be significantly positive.
 Source: Beyond Charts
Gary Stone is the Founder and Managing Director of Share Wealth Systems.
Important: This content has been prepared without taking account of the objectives, financial situation or needs of any particular individual. It does not constitute formal advice. Consider the appropriateness of the information in regards to your circumstances.