“The share price of Macquarie Group (MQG) took a hammering in the month of March due to investor concern around stability and risks in the financial sector,” Michael said.
“With those risks dissipating, it is worth looking at the share price chart to determine if these are good levels to be buying into Macquarie Group.
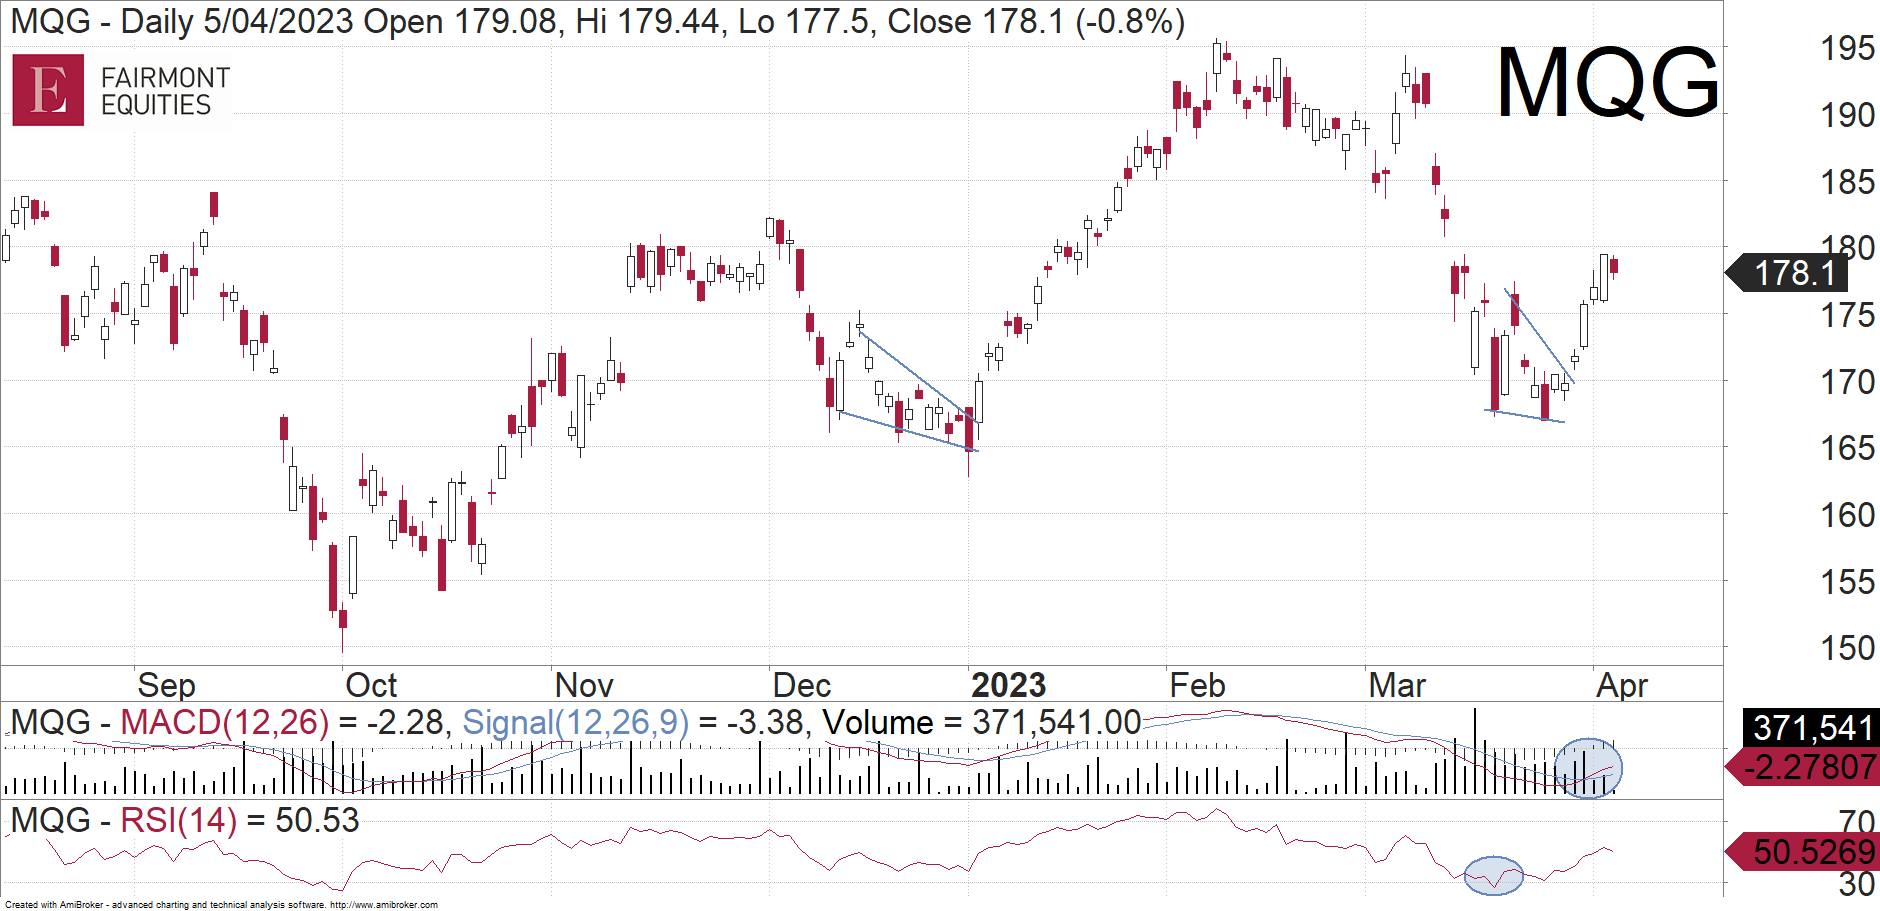
“Looking back at the past year, we can see that MQG has now put in two higher lows since October.
“It does seem to be establishing an uptrend.
“The recent decline in March saw the stock become oversold on the daily RSI, along with triggering a buy signal on the Moving Average Convergence/Divergence (MACD) indicator (both circled).
“I also noticed that the share price tightened up at the end of March.
“Then the rally in the last few days was on good volume.
“Price action here is not too dissimilar to what we saw in January.
“This confluence of positive signs on the share price chart is indicating to me that current levels represent a buying opportunity,” Michael said.

Important: This content has been prepared without taking account of the objectives, financial situation or needs of any particular individual. It does not constitute formal advice. Consider the appropriateness of the information in regards to your circumstances.

