

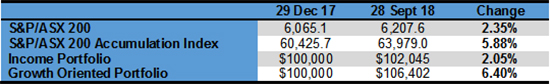
Ongoing trade tremors saw the Australian share market pull back from 10-year highs, to ease by 1.77% in September. Including dividends, the market lost 1.26%.
Our model portfolios largely tracked the market in September. Year-to-date, our model income portfolio, which is overweight financials and communication services, has underperformed the index by 3.8%, while our model growth portfolio has outperformed the index by 0.5%.
In our ninth review for the year, we look at how our income and growth portfolios performed in September. The purpose of these portfolios is to demonstrate an approach to portfolio construction. As the rule sets applied are of critical importance, we provide a quick recap on these.
Portfolio recap
In January, we made some adjustments to our Australian share ‘Income Portfolio’ and ‘Growth Portfolio’ (see https://switzersuperreport.com.au/our-portfolios-for-2018/).
The construction rules applied were:
- A ‘top down approach’ that looks at the prospects for each of the industry sectors;
- For the income portfolio, we introduced biases that favour lower PE, higher yielding sectors;
- So that we are not overly exposed to a market move, in the major sectors (financials and materials), our sector biases will not be more than 33% away from index. For example, the weighting of the ‘materials’ sector on the S&P/ASX 200 is currently 18%, and under this rule, our possible portfolio weighting is in the range from 12% to 24% (i.e. plus or minus one third or 6%);
- We require 15 to 20 stocks (less than 10 is insufficient diversification, over 25 it is too hard to monitor), and have set a minimum stock investment size of $3,000;
- Our stock universe is confined to the S&P/ASX 100. This has important implications for the growth portfolio, because the stocks with the best medium-term growth prospects will often come from outside this group (the so called ‘small’ caps);
- We avoid stocks from industries where there is a high level of exogenous risk, such as airlines;
- For the income portfolio, we prioritise stocks that pay fully franked dividends and have a consistent record of paying dividends; and
- Within a sector, the stocks are broadly weighted to their respective index weights, although there are some biases.
Overlaying these processes are our predominant investment themes for 2018, which we expect to be:
- Synchronised growth in the USA, Europe, China and Japan;
- The US Fed likely to increase US interest rates by 0.75%,
- Interest rates in Australia to remain at historically low levels, with the RBA unlikely to move rates higher until the final quarter of 2018. Some upward movement in bond rates;
- The Aussie dollar at around 0.75 US cents, but with risk of breaking down if the US dollar firms;
- Commodity and energy prices remaining reasonably well supported;
- A positive lead from the US markets;
- A moderate pickup in growth in Australia, back towards trend levels; and
- No material pickup in domestic inflation.
Performance
The income portfolio to 28 September is up by 2.05% and the growth-oriented portfolio is up by 6.40% (see tables at the end). Compared to the benchmark S&P/ASX 200 Accumulation Index (which adds back income from dividends), the income portfolio has underperformed the index by 3.83% and the growth-oriented portfolio has outperformed the index by 0.52%.
Resource sectors fire up as healthcare takes a breather
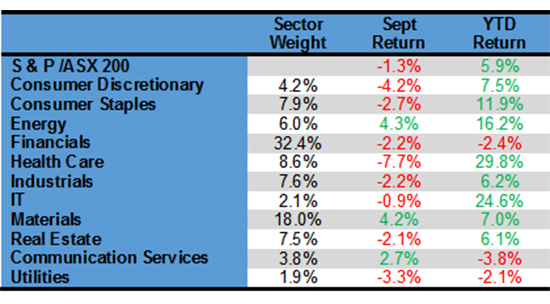
On the back of firmer oil and metal ore prices, the resources sectors recorded strong gains in September. Energy was the best performing sector on the market, with a gain of 4.3%, while materials added 4.2%.
Healthcare, which is the best performing sector on the ASX this calendar year, with a return of 29.8%, lost 7.7% in September. Profit taking in the sector’s largest stock, CSL, was largely responsible.
The largest sector on the ASX, financials, with a market weighting of 32.4%, lost 2.2%. Over 2018, it continues to be a major drag on the market, with a loss of 2.4%.
Individual sector returns (for the month of September and calendar year 2018) are set out in the table below.
Income portfolio
On a sector basis, the income portfolio is moderately overweight financials and index-weight materials. Exposure is being taken through the major banks (to the former), and the major miners (to the latter).
It is underweight health care, consumer staples and real estate.
In a bull market, we expect that the income-biased portfolio will underperform, relative to the standard S&P/ASX200 price index, due to the underweight position in the more growth-oriented sectors and the stock selection being more defensive, and conversely in a bear market, it should moderately outperform.
The portfolio is forecast to generate a yield of 5.13% in 2018, franked to 88.8%. The inclusion of Transurban and Sydney Airport, while adding to the defensive qualities of the portfolio, drags down the franking percentage.
In September, the income portfolio lost 1.02%, which took its year to date return to 2.05%, 3.83% below the accumulation index return. It benefitted in September from the performance of BHP, Rio, Woodside and Telstra, and suffered from the underperformance of the major banks, Transurban and Sydney Airport. No changes to the portfolio are contemplated at this point in time.
From an income point of view, the portfolio has returned 4.29%, franked to 93.2% this year. This is tracking to plan and we remain confident that the full year forecast of 5.13% will be met.
The income-biased portfolio per $100,000 invested (using prices as at the close of business on 28 September 2018) is as follows:
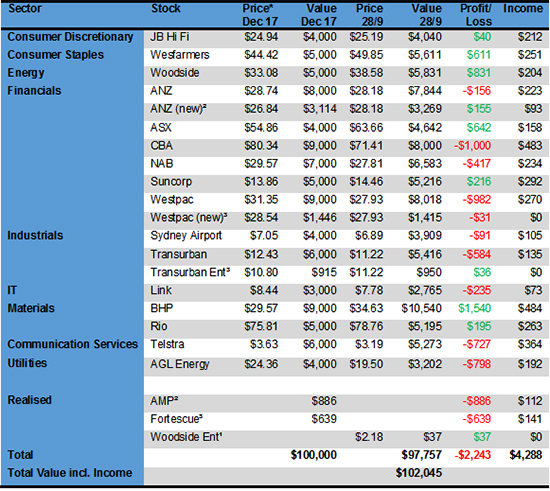
* Closing price 29/12/17
- Woodside 1:9 entitlements at $27.00 per share. Assume sold on last day of trading.
- AMP shares sold on 30 April @ $4.04, loss of $886 realised. Balance of $3,114 invested in ANZ @ $26.84
- Fortescue shares sold on 31 August @ $3.84, loss of $639 realised. Balance re-invested in Transurban Entitlement issue (10 for 57 @ $10.80) and $1,446 Westpac @ $28.54.
Growth portfolio
The growth portfolio is moderately overweight materials, financials and consumer discretionary. It is underweight consumer staples, industrials and real estate. Overall, the sector biases are not strong.
The stock selection is marginally biased to companies that will benefit from a falling Australian dollar – either because they earn a major share of their revenue offshore, and/or report their earnings in US dollars. While we expect that the Aussie dollar will remain well supported, and trade in a fairly narrow range in the short term, the risk is that a strengthening US dollar causes it to break down.
In September, the growth portfolio lost 1.6%, which took its year to date return to 6.4%. It has outperformed the accumulation index this year by 0.52%.
Profit taking in CSL saw it shed more than 10% in September, to close at $201.11, but still up 42% for the year. Many other stocks also eased, with losses offset by gains on BHP, Rio and Woodside.
No changes to the portfolio are contemplated at this point in time.
Our growth-oriented portfolio per $100,000 invested (using prices as at the close of business on 28 September 2018) is as follows:
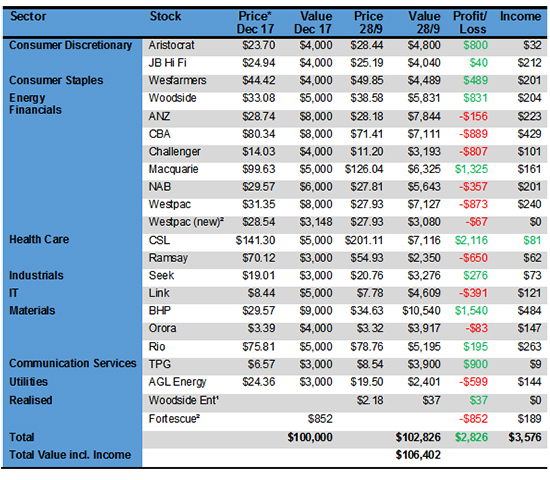
* Closing price 29/12/17
- Woodside 1:9 entitlements at $27.00 per share. Assume sold on last day of trading.
- Fortescue shares sold on 31 August @ $3.84, loss of $852 realised. Re-invested in $3,148 Westpac @ $28.54.
Important: This content has been prepared without taking account of the objectives, financial situation or needs of any particular individual. It does not constitute formal advice. Consider the appropriateness of the information in regard to your circumstances.