

It’s been a positive finish for Wall Street after a negative week, with those long on tech stocks going to like the strong day for the Nasdaq, as fund manager Charlie Aitken’s beloved Microsoft hit all-time highs following news it will raise the price of its flagship products by, wait for it, 20%!
This has been a good day for US stocks but not a great week. Historically, August is a ‘crappy’ month for stocks and a whole lot of other non-market stuff has added to the crappiness. By the way, considering what’s out there, the market’s showing was pretty damn good.
On Wall Street over the month so far, defensives have done well, cyclicals have reacted badly to forecasts of slower-than-expected economic outlooks and volumes of share activity are low. August will also bring short spikes up, like the one overnight, with the S&P 500 up over 0.8% — but you don’t usually get many of these across the month.
By the way, history also shows that August is negative at the beginning and end of the month, as the expiry of options and other derivatives hit share prices, and this bad market vibe rolls into September.
For a better appreciation of what happened this week, let’s get AMP Capital’s Shane Oliver’s take on what drove stocks: “Global share markets had a rough week reflecting a confluence of bad news – Afghanistan, China’s continuing regulatory crackdown, worries about the Delta wave in the US and the Fed’s meeting minutes confirming that reduced bond buying (or tapering) is getting nearer.
“Reflecting the weak global lead, Australian shares also fell, not helped by a further rise in cases and more lockdown extensions locally, along with the continuing slide in iron ore prices, with resources and financials leading the fall. Consistent with the risk off tone, bond yields generally fell as did oil and metal prices and the $A, as the $US rose.”
Stop and take a picture of most of this and then factor in what happens in six months’ time when vaccination rates are higher, the virus is less challenging and we’re out of lockdown. It’s bound to coincide with an economic rebound and this explains why I can see a sell off of sorts over August and September. But as we get into October and November, attitudes become more positive.
This chart comes from my Weekend Switzer story today and you can see my wider analysis on a potential pullback of stocks here.
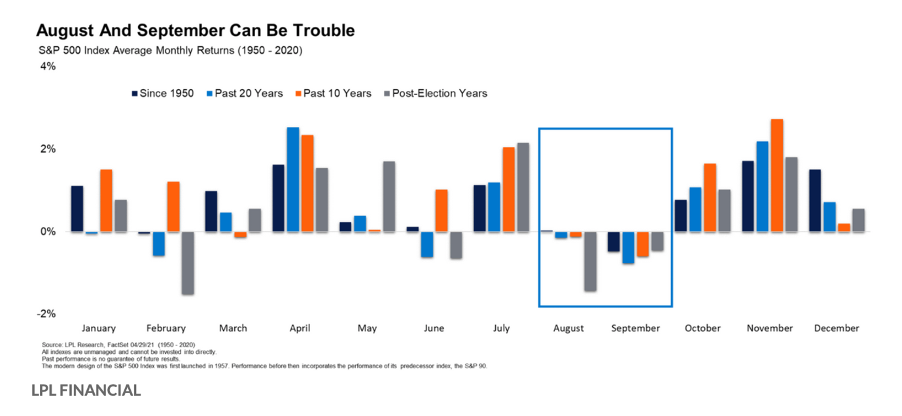
Note how August to September is historically bad for stocks, as this 1950 to 2020 study shows. However, things really brighten up from October.
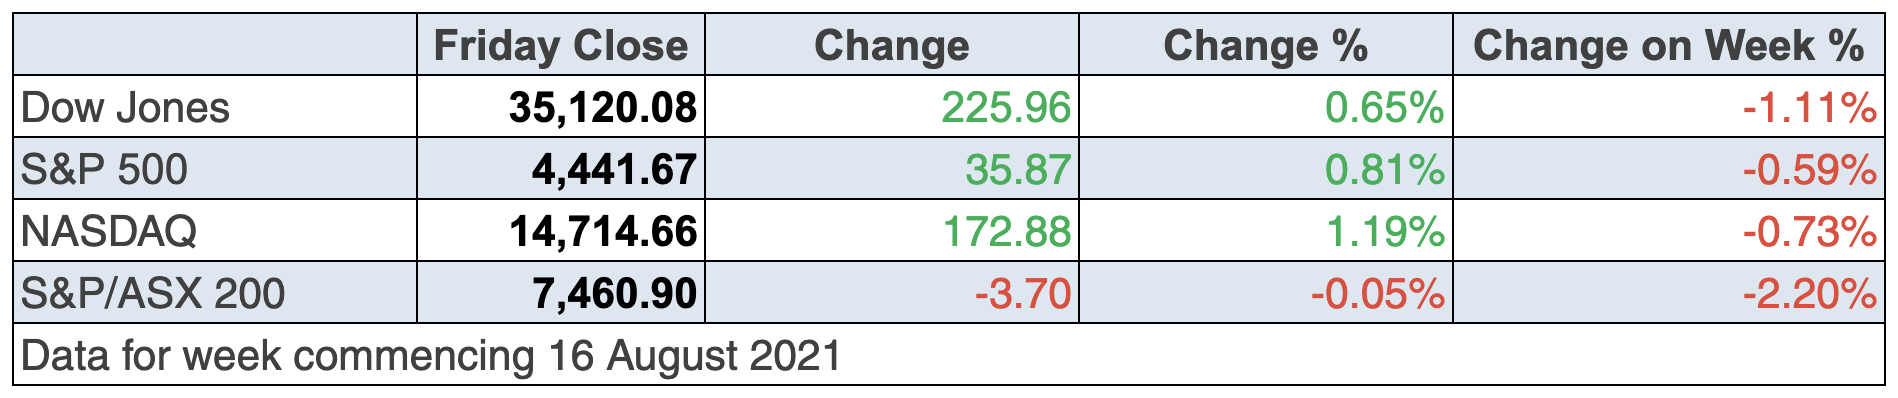
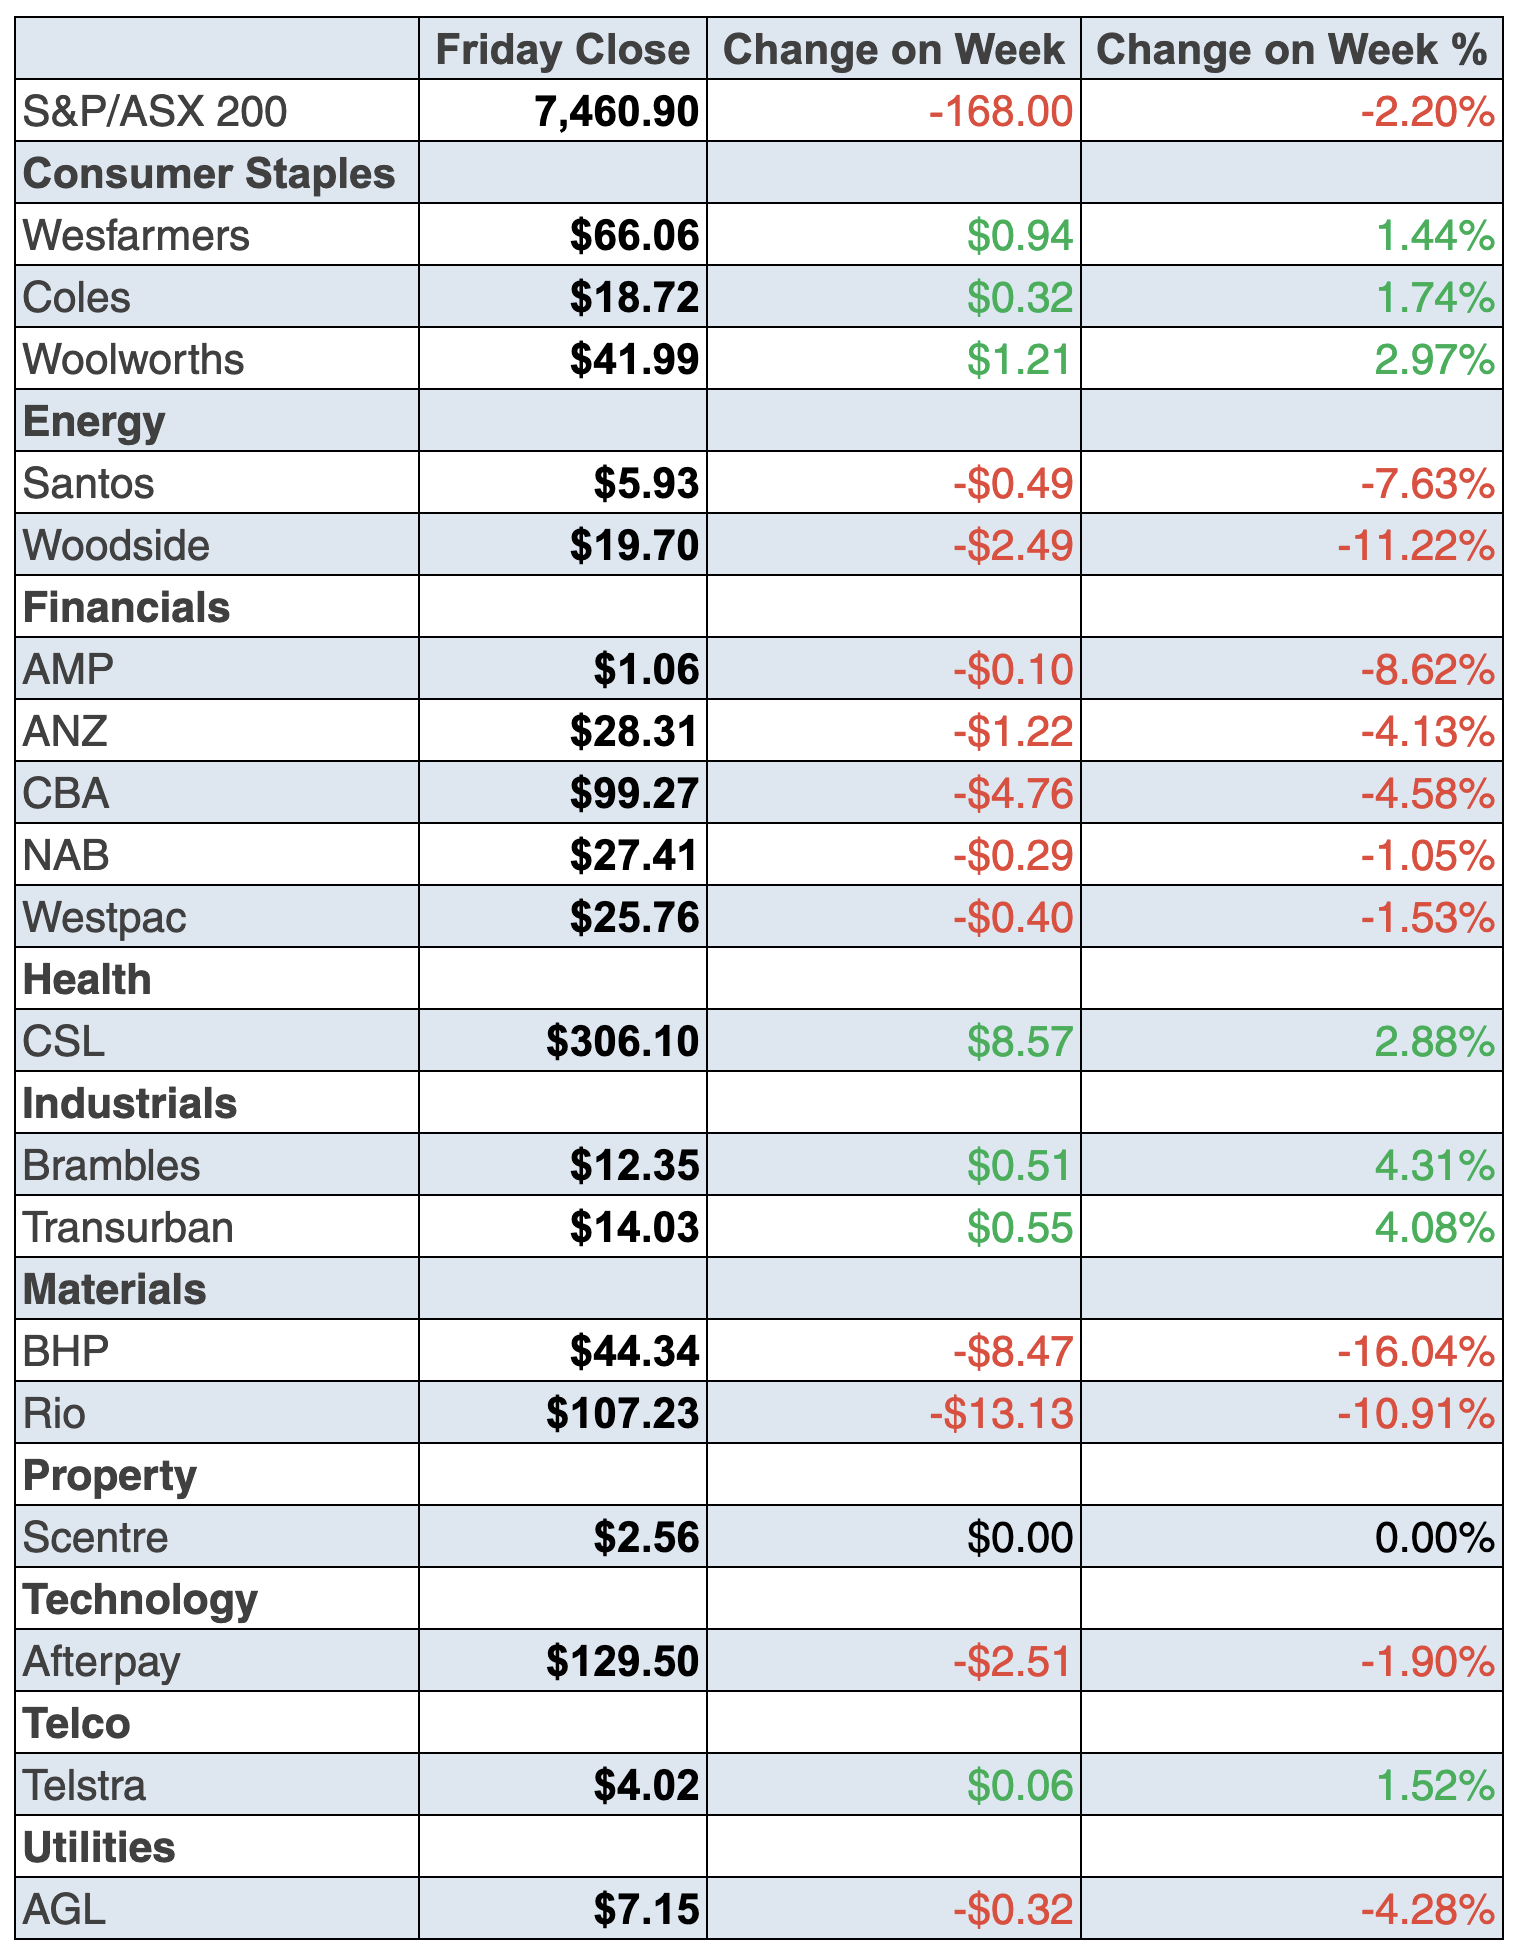
To the local story and our S&P/ASX 200 Index fell every day this week (which is very August), with the market indicator down 2.2% for the week to 7460.9.
The overall sell off was driven by lower commodity prices as economists are factoring the brake on growth likely for the world economy because of the fallout from the Delta variant of the Coronavirus.
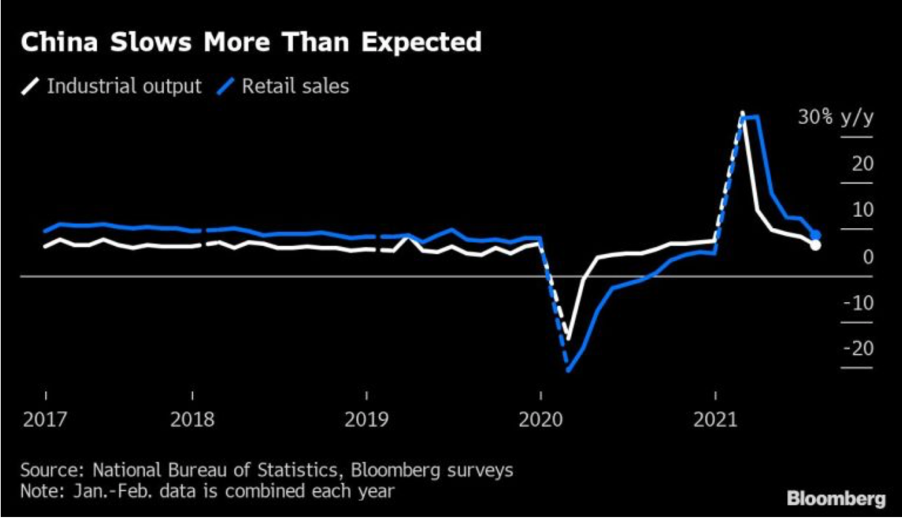
In case this is news to you, check this out from Bloomberg.com: “China’s economy slowed more than expected in July, adding to signs that the global recovery is coming under pressure as the delta virus variant snarls supply chains and undermines consumer confidence.”
And this explains some more challenges for China: “Retail sales were hit by tough new virus restrictions introduced toward the end of the month to contain fresh outbreaks. Flooding in central China and weak auto sales due to a chip shortage hurt manufacturing, while a slowing property market and environmental policies reduced output of steel and cement, hitting commodity demand.”
And that’s why mining stocks, led by Lynas and BHP, had such a bad week. This Bloomberg table says it all:
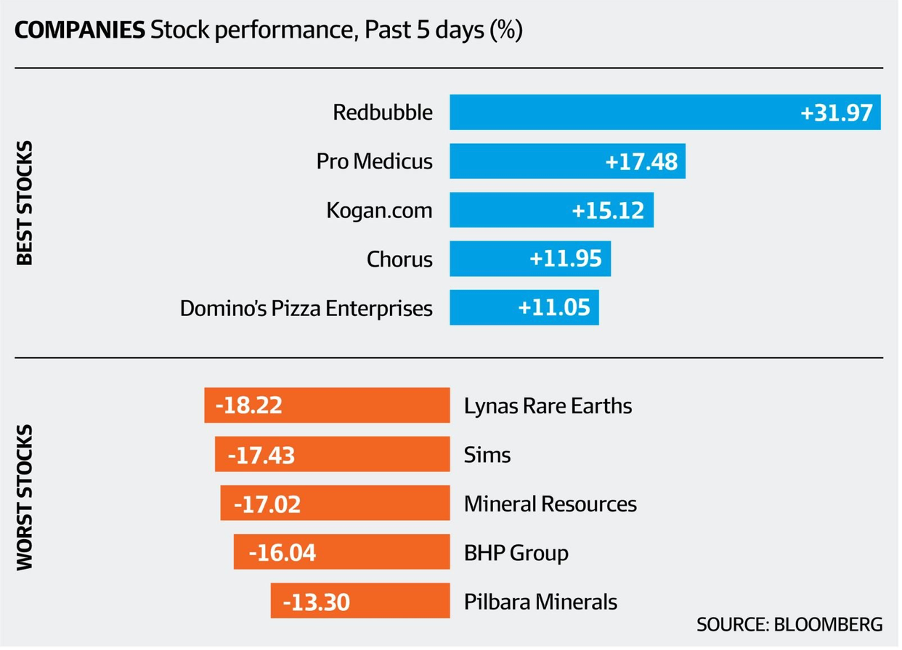
We tried to work out why the market didn’t get enthusiastic about BHP’s report, innovations going forward and good dividend but the negativity was really driven by all the forces hurting global growth and its best customer — China!
By the way, this concern about future economic growth (which I see only as a temporary ditch in the road) wasn’t helped by the US Federal Reserve’s latest meeting minutes and talks about reducing stimulus.
In many ways, if you look at the big winners for the week, such as Kogan, Domino’s and Redbubble, they’re all the kinds of businesses that do well in lockdowns.
Not surprisingly, travel stocks hit a bit of turbulence.
Qantas lost 6.4% to $4.25, Webjet 7.4% to $4.77 and Corporate Travel gave up 5.2% to $21.10.
These will be stock price rebounders when vaccination rates lead to the reopening of our country and others around the world. They’re for the patient. But those who drive weekly share prices are more short-term players, such as fund managers who cop it if they don’t deliver results ASAP.
What I liked
- The weekly ANZ-Roy Morgan consumer confidence rating rose by 2.5% (the most in 18 weeks) to 101.1 (long-run average since 1990 is 112.5). Sentiment is now back above the neutral level of 100. How did that happen, with NSW and Victoria in lockdown? Are we starting to enjoy ‘prison’?
- Employment here rose by 2,200 jobs in July after rising by 29,100 jobs in June. Full-time jobs fell by 4,200 and part-time jobs rose by 6,400. This was nice to see but the good news won’t last because August will show the jobs blowout from the lockdowns.
- Our main measure of wages – the Wage Price Index (WPI) – rose by 0.4% in the June quarter to be up 1.7% on a year ago (survey: 1.9%). Private sector wages rose 0.5% in the quarter to be 1.9% higher, when compared to a year ago.
- A sign that the US economy is doing well, with the Fed’s Open Market Committee telling us: “Looking ahead, most participants noted that, provided that the economy were to evolve broadly as they anticipated, they judged that it could be appropriate to start reducing the pace of asset purchases this year.” Hope these guys are right!
- The US Conference Board leading index rose by 0.9% in July (survey: 0.7%).
- The euro zone economy rose by 2% in the June quarter.
What I didn’t like
- The Reserve Bank of Australia (RBA) Board released the minutes of its August 3 meeting. The Board re-affirmed its decision to pare back bond purchases, noting that fiscal policy was more appropriate than monetary policy to provide temporary short-term support to the economy. Not sure if we need the big Bank to reduce stimulus now with recession talk all around.
- CBA Group economists reported that national household credit and debit card spending for the week ended 13 August 2021 “…showed a 5% drop in spending growth from the previous week.”
- The CBA Household Spending Intentions (HSI) showed declines for home buying, retail, travel, entertainment, education and motor vehicle spending intentions in July.
- US retail sales fell by 1.1% in July (survey: minus 0.3%).
- The NAHB housing market index in the US fell from 80 to 75 in August (survey: 80)
- The New York Empire State manufacturing index fell from a record 43 to 18.3 in August (survey: 28.5)
- Soft Chinese economic data and concerns about the Taliban victory in Afghanistan dampened risk appetite and lowered bond yields earlier in the week.
The only ‘economic’ indicator in town
Since February 2020, there has been a new set of non-economic indicators that have become the critically important ‘economic signposts’. Last year, it was infection rates and people like bond fund manager Chris Joye made his team of market analysts use their grey matter to become infection forecasters!
Now it’s all about vaccination rates as the higher this indicator goes, the faster the growth rebounds and the quicker stocks linked to reopening of the economy head north. And we wave goodbye to these cursed lockdowns!
The week in review:
- Here’s a quality company that fits my view that certain stocks will be key beneficiaries of the reopening of our economy and Aussies getting back to going out and celebrating the end of lockdowns.
- Paul Rickard crunched the numbers this week to show who should and shouldn’t accept Commonwealth Bank’s (CBA) share buyback.
- Tony Featherstone put forward 3 stocks to consider in anticipation of a post-Covid economic resurgence: Kathmandu Holdings (KMD), Ooh Media (OML) and Maca (MLD).
- James Dunn looked at 6 stocks that could be the next Afterpay in the buy-now-pay-later (BNPL) sector: Zip Co (Z1P), Laybuy Group (LBY), Sezzle (SZL), Humm (HUM), Splitit Payments (SPT) and Openpay Group (OPY)
- In our “HOT” stocks this week, Raymond Chan from Morgans looked at QBE (QBE), Suncorp (SUN) and IAG (IAG), and Michael Gable from Fairmont Equities suggested Pro Medicus (PME).
- In the first Buy, Hold, Sell – What the Brokers Say for this week, there were 6 upgrades and 15 downgrades, and in the second edition there were 4 upgrades and 11 downgrades.
- And in Questions of the Week, Paul Rickard answered questions on Woodside Petroleum (WPL), Deterra Royalties (DRR), the Westpac Capital Notes 8 offer, QBE (QBE) and the Commonwealth Bank (CBA) share buyback.
Our videos of the week:
- Boom! Doom! Zoom! | August 19, 2021
- Should you buy or dump BHP, TLS, CSL and QBE + is the property market still on the rise? | Switzer Investing
- ASX Stocks to buy: BSL, A2M, MNS, QUB & Suncorp + CBA buy back explained! | Switzer Investing
Top Stocks – how they fared:
The Week Ahead:
Australia
Monday August 23 – ‘Flash’ Markit purchasing managers’ indexes (Aug.)
Tuesday August 24 – Weekly consumer sentiment index (August 22)
Tuesday August 24 – Australian business counts (June)
Wednesday August 25 – Construction work done (June quarter)
Wednesday August 25 – Reserve Bank official speech
Thursday August 26 – Business investment (June quarter)
Thursday August 26 – Weekly payroll jobs & wages (July 31)
Friday August 27 – Retail trade (July)
Overseas
Monday August 23 – US Chicago Fed national activity index (July)
Monday August 23 – ‘Flash’ Markit purchasing managers’ indexes (Aug.)
Monday August 23 – US Existing home sales (July)
Tuesday August 24 – US New home sales (July)
Tuesday August 24 – US Richmond Fed manufacturing index (August)
Wednesday August 25 – US Durable goods orders (July)
August 26-27 – US Federal Reserve Jackson Hole symposium
Thursday August 26 – US Economic (GDP) growth (June quarter)
Thursday August 26 – US Kansas City Fed manufacturing index (Aug.)
Friday August 27 – US Personal income & spending July)
Friday August 27 – US Advance goods trade balance (July)
Friday August 27 – China Industrial profits (July)
Food for thought:
“Dividends may not be the only path for an individual investor’s success, but if there’s a better one, I have yet to find it.” – Josh Peters
Stocks shorted:
ASIC releases data daily on the major short positions in the market. These are the stocks with the highest proportion of their ordinary shares that have been sold short, which could suggest investors are expecting the price to come down. The table shows how this has changed compared to the week before.
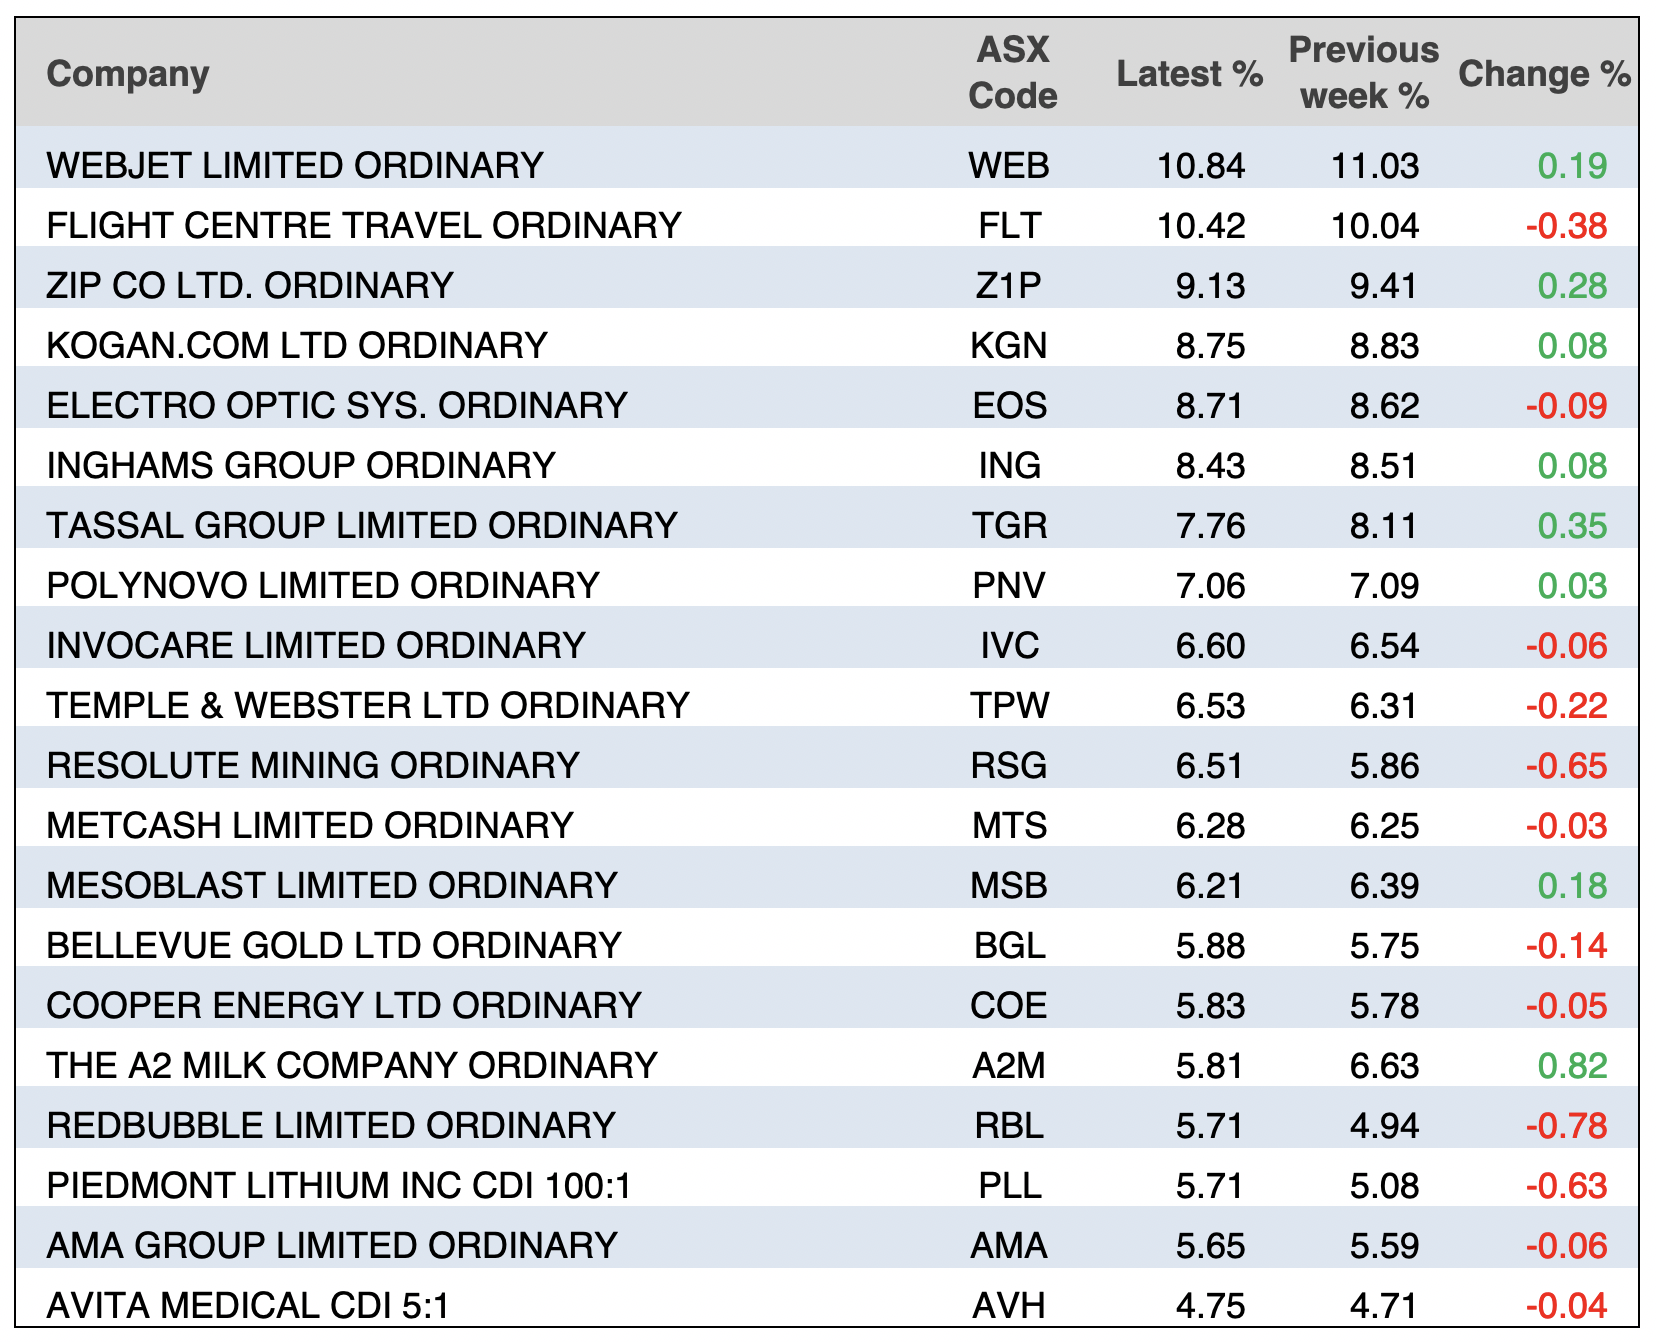
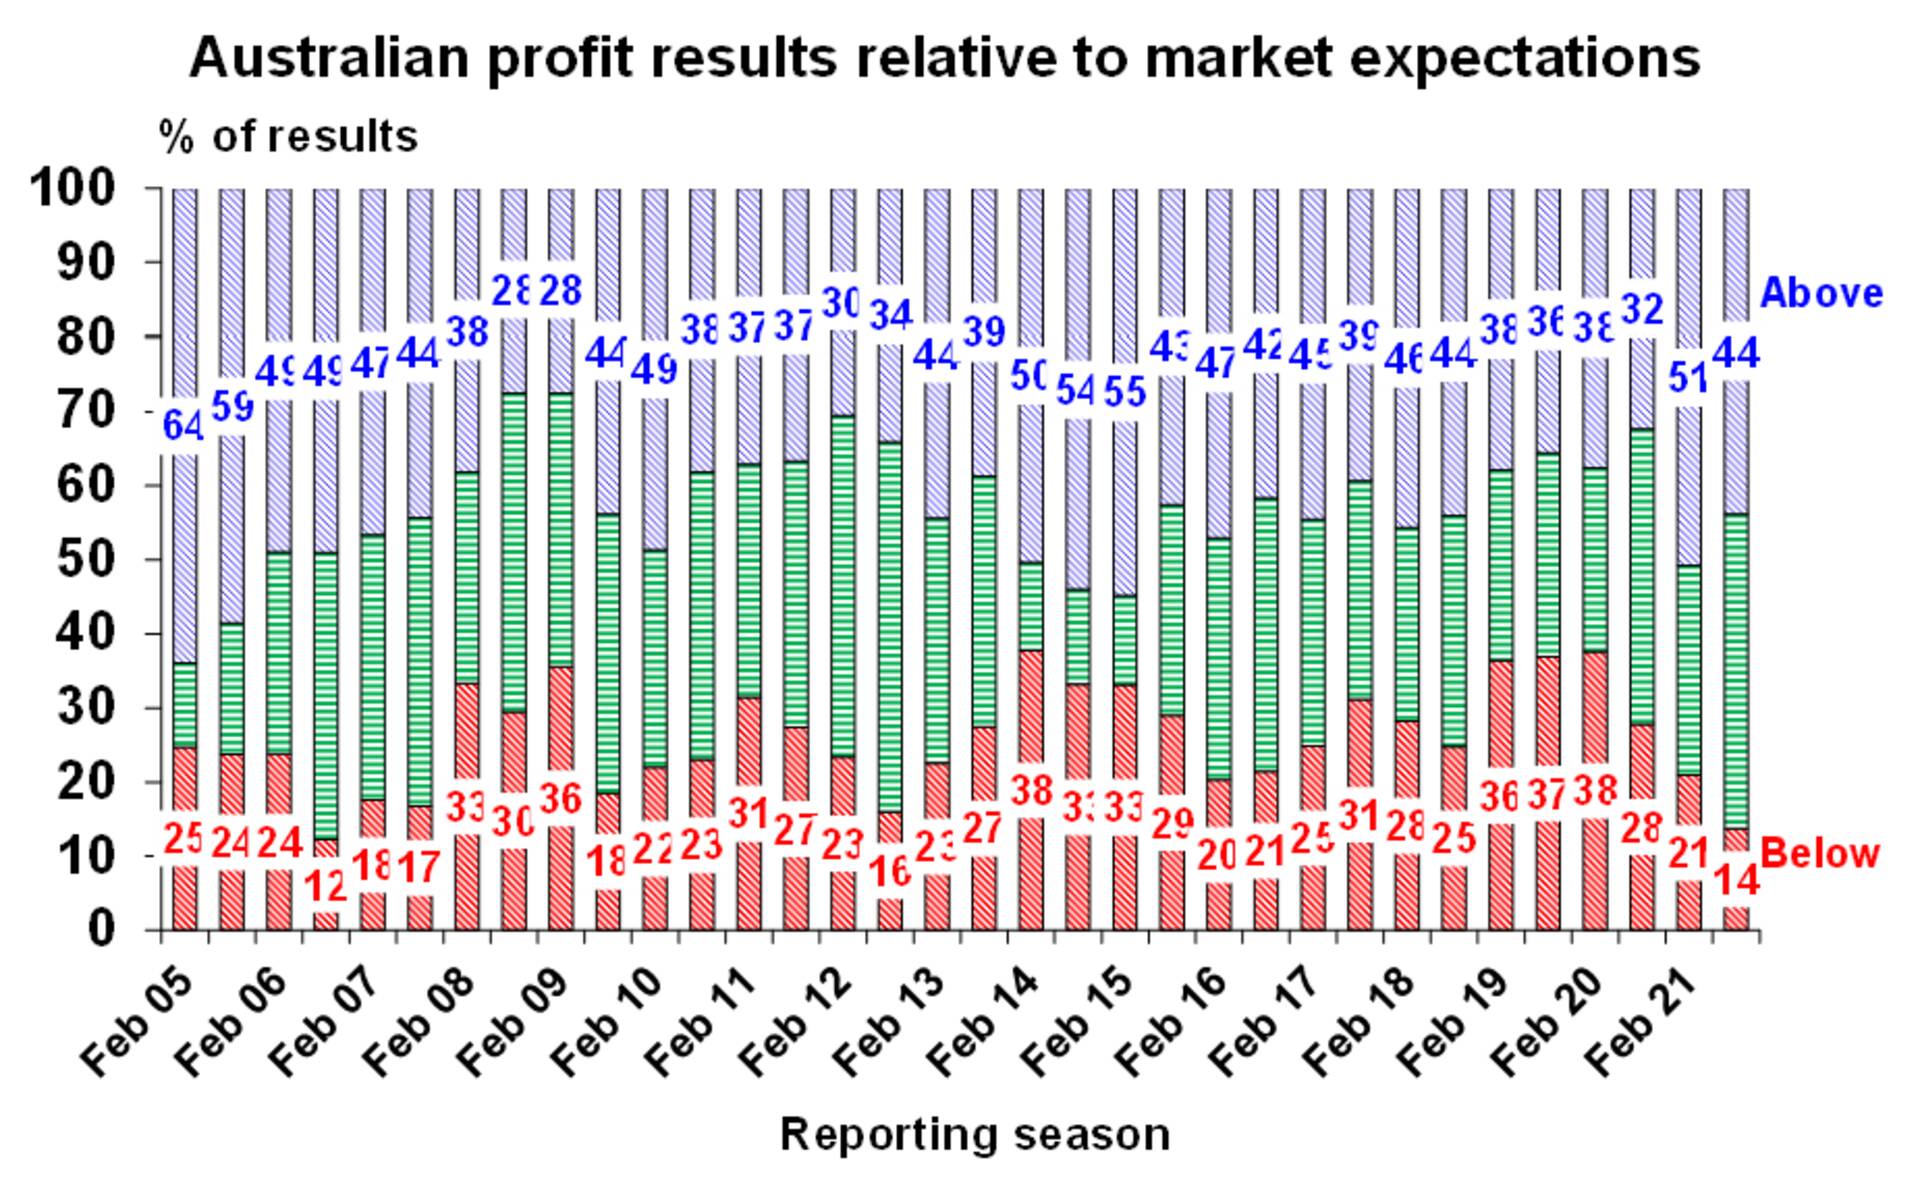
Chart of the week:
Following on from last week’s chart, 44% of results have now beaten market expectations so far in reporting season as seen in this chart from AMP Capital’s Shane Oliver:
Top 5 most clicked:
- A quality company with 36% upside – Peter Switzer
- CBA’s buyback is a “no brainer” for some shareholders – Paul Rickard
- My 3 ‘reopening’ stock selections – Tony Featherstone
- Who’s the next Afterpay in the BNPL space? – James Dunn
- Buy, Hold, Sell – What the Brokers Say – Rudi Filapek-Vandyck
Recent Switzer Reports:
- Monday 16 August: A quality company with 36% upside
- Thursday 19 August: My 3 ‘reopening’ stock selections
Important: This content has been prepared without taking account of the objectives, financial situation or needs of any particular individual. It does not constitute formal advice. Consider the appropriateness of the information in regards to your circumstances.