

Both bulls and bears generally agree we are in the late stage of a global bull market. View the historical chart of America’s S&P500 share index below. The bears think the market is topping because it is overstretched and world growth is slowing. The bulls think it has further to run because with interest rates close to or below zero only dividend paying shares offer meaningful returns.

Which begs the question: what is likely to happen next? Which asset classes could win in the next round as aggressive investors hunt yield and defensive investors seek shelter?
Possible market switch
In the quest for yield, shares offering a high earnings yield (i.e. value stocks) should have more price upside than stocks with a low earnings yield (i.e. growth stocks), given that global economic growth (and corporate earnings) are slowing. Below is a chart showing rolling 10 year returns for value versus growth indices since 1936. Notice that value stocks have traditionally beaten growth stocks but for the last decade have done the opposite.
Commenting on the chart David Brett, Investment Writer at Schroders, says:
“Value in the five years following its underperformance trough in 1940 outperformed growth by 138%. Similarly, when value’s two-year underperformance troughed in 1999 it outperformed growth by 107%. The question for value investors now is could history repeat itself?”

Nick Kirrage, an equity value fund manager at Schroders, observes:
“We know we should buy low and sell high. We are looking for investment strategies that are enduring and we want to buy them when they look cheap and attractive.
“When we look across investments in the market today we see a huge bias in investors’ portfolios towards growth-type investments. That presents an opportunity, to diversify and buy into a strategy that has a great long-term success record.
“So why now? Because, we believe, with value stocks at such attractive levels the opportunity has never been greater.”
The other possibility is that undervalued markets might now grow faster than overvalued markets. Also in a global crash, lagging markets might fall less than soaring ones. The following chart shows how prices for ASX listed equity funds for the USA (IVV, blue), other developed markets (IVE, brown), Asia (IAA, red) and emerging markets (IEM, green) have fared since the end of the global financial meltdown in March 2009. They are all expressed in Australian dollars. Notice how far America is in front followed by Asia with both other developed markets and emerging markets trailing far behind.
Comparative Performance of Major Regional Stock Markets, 2009 – 2019

One approach to investing internationally is to choose those markets that exhibit the lowest cyclically adjusted price earnings ratios (CAPE). A CAPE ratio for any stock market is arrived at by taking the average of the last 10 years of earnings of the companies that comprise its stock index (e.g. S&P500), adjusting it for inflation, and then dividing the current index price by that adjusted earnings.
Investing in countries with a higher CAPE in any year delivers lower future returns than investing in countries with a lower CAPE. Here’s a chart to prove it for the USA between 1881 and 2013 and for all other equity markets between 1979 and 2013.

Meb Faber, the chief investment officer of Cambria Investments, has calculated that investing in the cheapest 25% of countries in terms of CAPE would have outperformed the S&P 500 index between 1993 and 2018 (orange line vs dark blue line). The contrast is stark: the cheapest markets would have delivered a 3,052% gain versus the S&P500’s return of 962%. See chart below.
Returns on Global Market Indices with Low CAPE ratios versus S&P500 Index and other Trading Strategies 1993-2018

So which countries now offer the lowest and highest CAPE ratios? Here are the latest calculations by StarCapital Research for the USA, Japan and major regional markets. What is clear is that the US market is highly overvalued, Japan is overvalued, developed Europe is slightly overvalued and emerging markets, especially emerging European markets, look relatively cheap.
CAPE Ratios for USA, Japan and other market sectors 30.8 2019

Source: https://www.starcapital.de/en/research/stock-market-valuation/
Devan Kaloo, head of equities for Aberdeen Standards Investments, writing in last weekend’s Australian Financial Review said this about emerging markets:
“Company fundamentals are good and in some cases the best we’ve seen in quite some time. Balance sheets and cashflows have improved while net leverage has fallen pretty much across the board. We appear to have hit bottom on earnings revisions
“True, the next few years will be challenging and we expect further bouts of volatility. However, companies are in better shape than in previous years and valuations are supportive. EM remains a fertile hunting ground for bottom-up stock pickers.”
While fundamental analysis suggests that value stocks and emerging market stocks should do better than growth stocks and developed market stocks over the next decade, actual returns over the last year show that this change of guard has not yet happened.
Take for instance the Vanguard Growth and Value index funds for the USA. See next two charts. These are available as ETFs on the NYSE. In US dollars, the Growth fund returned 4.7% over the year to August whereas the Value fund returned just 0.7%. Value is clearly still in the doldrums. In Australia, Vanguard offers a Global Value Equity Active ETF (VVLU) and Global Growth Equity Active managed fund.
Vanguard’s US Growth Index Fund 2009-2019

Source: https://investor.vanguard.com/mutual-funds/profile/overview/vigax
Vanguards US Value Index Fund 2009 – 2019

Source: https://investor.vanguard.com/mutual-funds/profile/overview/vviax
Perpetual has a “pure value” Australian share fund that commenced in 2008. Clime Capital Limited (CAM) was listed on the ASX in 2004 and also uses “value investing” principles. Not surprisingly, these two funds being value not growth-oriented trailed the All Ords Accumulation Index over the last six years.
Also, developed markets are still outpacing emerging markets. Over the year to August, Vanguard’s International Shares ETF (VGS), which covers developed markets retuned 7.7% whereas Vanguard’s Emerging Markets ETF (VGE) returned 5.2%. Both are listed on the ASX and expressed in Australian dollars.
Other ASX emerging market funds are iShares MSCI Emerging Markets ETF (IEM) and Fidelity Global Emerging Markets ETF (FEMX).
Conclusion
If the future reverts to trend either by undervalued sectors catching up or overvalued sectors falling back then exposure to value share funds and emerging market funds has appeal. At present, both growth stock funds and developed market funds show the strongest price momentum over the last 3 to 9 months. See the 9 months chart below. But this could change if tech stocks run out of puff and cyclical stocks complete their shakeout.
Relative Strength Momentum of Growth Stock, Value Stock, Developed Market and Emerging Market Funds over last nine months
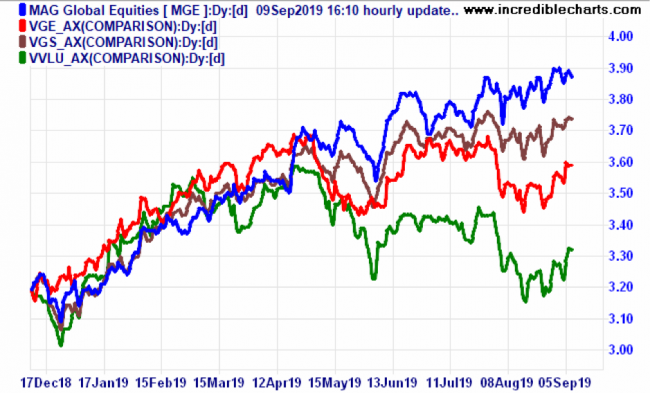
Chart Note: In the absence of an ASX listed Vanguard global growth stock ETF we have used MAG which is the ASX listed Magellan Global Equities ETF that invests in quality growth stocks. The comparative funds are Vanguard ASX listed ETFs VVLU (global value stocks), VGS (developed markets) and VGE (emerging markets).
Important: This content has been prepared without taking account of the objectives, financial situation or needs of any particular individual. It does not constitute formal advice. Consider the appropriateness of the information in regard to your circumstances.