Interest rates will soon start falling in the US and we could see our first cut on Cup Day. Stock prices are falling as well right now, but what usually happens when the US central bank starts to cut? Of course, while history is never a 100% guide for the future, in the absence of a reliable crystal ball, the past can give clues about the future.
And my market mentor, Warren Buffett, has questioned the value of history of markets for investing successfully by once saying: “If past history was all that is needed to play the game of money, the richest people would be librarians.” This isn’t really a put down of history for investing but he is arguing it’s not the be all and end all when it comes to investing. I make my calls based on history, the macroeconomic outlook, the progress of profits of key companies, the prevailing valuations, geopolitical issues and the overall “vibe”, to quote the lawyer from the movie The Castle.
So, let’s look at the future for investing using these key market tests.
First, the history. This from CNBC is a good start: “CNBC Pro analysed stock market data over the past six tightening cycles since 1982, when the Federal Reserve switched to targeting the federal funds rate. The analysis found that, on four occasions the S&P 500 had risen by double digits within a year after a rate cut.” It then added: “When stocks rose, on average, they were up 6% in the quarter immediately after the cut and up 16% in the 12 months after the cut. However, stocks fell soon after the rate cut in 2001 and 2007 by 13.5% and 20.6% respectively, due to the dotcom crash and the global financial crisis. Three months after the cut, the S&P 500 was down by 11% on average on those two occasions.”
So, the conclusion has to be when a market crash coincides with the likelihood of a serious recession, history says a period of rate cuts will not stop stock prices from collapsing for a period, but eventually there will be a rebound, once the economics improves. The Fed started cutting rates in September 2008 as the GFC took out Lehman Brothers, but by March 2009, the stock market started to recover and rose around 68% over the ensuing 12 months.
The past week sell-off for stocks was linked to concerns that the Fed has waited too long to cut and now there’s a chance the US will go into recession. That said, it wouldn’t be a recession of a GFC kind, which was tagged The Great Recession.

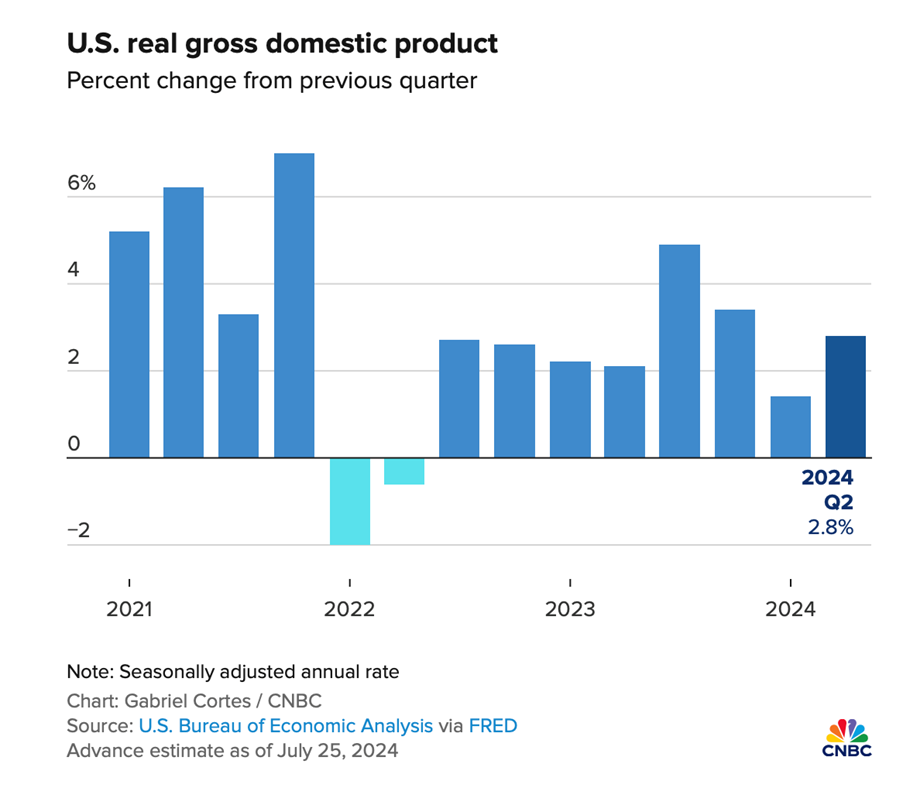
Now it’s time to look at my second stocks test — the economy. Right now, the Yanks don’t look like their economy is nosediving. The second quarter growth result was a good 2.8% and this is how apnews.com reacted to it: “US economic growth increased last quarter to a healthy 2.8% annual rate. The nation’s economy accelerated last quarter at a strong 2.8% annual pace, with consumers and businesses helping drive growth despite the pressure of continually high interest rates.”
Sure, this is an old number, but not very old. It makes me think if the US goes into a recession, it will be a shallow one, though only in June the likes of Deloitte was tipping no recession but a slowdown.
“Overall, we expect the US economy to post real GDP growth of 2.4% this year, but for growth to slow to 1.1% in 2025. Between 2026 and 2028, economic growth is expected to pick back up, with annual gains in real GDP forecasted to range between 1.6% and 1.9% per year.” By the way, the U.S. Bureau of Labor Statistics (BLS) projects the economy to grow by 2.1% each year on average, from 2021 to 2031, so that gives you an idea of how supportive the US economy will be for stock prices.
This week’s reaction to labour market data is a typical short-term overreaction. I think it creates buying opportunities for the long-term player.
Let’s go to the third test for stocks going forward, namely profits, and they are looking better than expected. This was AMP’s Shane Oliver’s take on US reporting season so far: “75% of US S&P 500 companies have now reported June quarter earnings. The results are good but proving more mixed and weaker than hoped for from tech stocks. 79.2% have beat earnings expectations, which is above the norm of 76% but below the experience of the last reporting season. Consensus expectations for earnings growth are now 9.7% year on year, up from 7.8% at the start of the reporting season.”
This clearly isn’t a bad report card for US company profits. While you always have to look at outlook statements, only three days ago IG’s Chief Market Analyst Chris Beauchamp wrote the following: “The latest pullback from the mid-July highs appears to have run its course. After stabilising around 5400 this week the index shot higher yesterday, bolstered by the Fed rate decision and the high likelihood of a September rate cut. The record highs of July are the next target.”
This was written before the Friday jobs report, which brought more negativity linked to recession fears, but I’d argue that Beauchamp’s view is less short-term and is more considered compared to the trigger happy stocks sellers late last week.
Now for my fourth test — valuations. This does give pause for optimists. The website currentmarketvaluation.com does the numbers for us and here they are for the S&P 500 Index: “The P/E ratio is a classic measure of a stock’s value indicating how many years of profits (at the current earnings rate) it takes to recoup an investment in the stock. The current S&P500 10-year P/E Ratio is 34.0. This is 67.5% above the modern-era market average of 20.3, putting the current P/E 1.7 standard deviations above the modern-era average. This suggests that the market is Overvalued.”
While this is important to reflect on, it would be more important if the Magnificent Seven stocks hadn’t distorted this Index’s rise.
“The S&P 500 is up over 44% since the end of 2022,” Motley Fool told us on July 9. “The primary reason is that the sectors containing Magnificent Seven stocks are outperforming the S&P 500 as a whole, while the other eight sectors are underperforming.”
These seven companies are now so valuable that they make up a combined 35.5% of the S&P 500. While I see the share prices of these companies being trimmed back, many of the other companies in the S&P 500 will benefit from lower interest rates that will start happening in September this year.
I noted with interest that the tech-heavy Nasdaq has lost 7.76% over the past month as the Magnificent Seven saw profit-takers hit their share prices, while the Dow Jones was up 1.09%. Old world companies are set to do well, while over-bought tech companies should be less popular. However, interest-rate sensitive tech/growth companies should do well.
And now for the final test — geopolitical issues. We have the wars in the Ukraine, the Middle East and the Trump/Harris political shootout in November, which all mix in with August to October being quite dodgy for stocks.
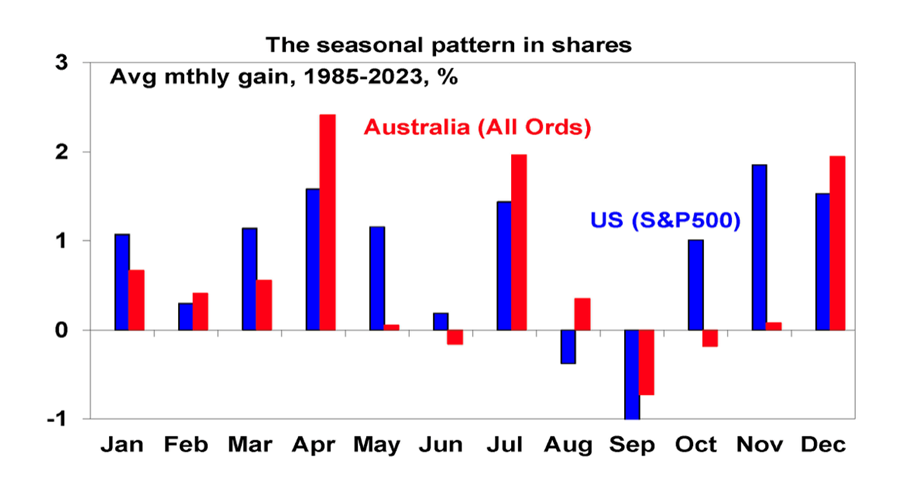
History says there is a September Effect, when markets underperform, but there isn’t an apparent reason for it. Some consider the observed weakness in September to be attributable to seasonal behavioural bias, as investors make portfolio changes to cash in at summer’s end, but there’s no credible reasoning for this weak time for stocks.
However, September and October have brough market crashes. The chart below for our All Ords and the S&P 500 shows how negative stock prices can be across August to October. Note how the S&P 500 really has a problem with August and September and it’s why I’m not spooked about the current sell-off.
On the subject of wars, an escalation of the Middle East war would be a short-term problem, but the history of these crises generally are only short-term negatives for stocks.

I also argue that the US election can mean some investors go to cash or play defensive until they see the result of who will lead the US for the next four years. While reticence to invest ahead of the November 5 election makes sense, I expect that if you add in the fact that for the US, the months of November to April are good for stocks, there’s bound to be a nice period of rising share prices helped by falling interest rates and a US economy that dodges a serious recession.
For the history buffs, this came out in April from bankrate.com: “The odds of the U.S. economy entering a recession within the next 12 months have now fallen to a two-year low of 33 percent, according to Bankrate’s latest quarterly economists’ poll. That’s after soaring as high as 65 percent back in the third quarter of 2022 and falling to about a coin-flip by the final six months of 2023.”
But this was thrown in and should be noted: “To be sure, only once has the Fed managed to raise interest rates and defeat inflation without causing a recession, suggesting the odds are still not in the U.S. central bank’s favour.”
Given US growth now, I suspect any recession will be shallow and short-lived, with rate cuts helping both the economy and stock prices.
Important informati on: This content has been prepared without taking account of the objectives, financial situation or needs of any particular individual. It does not constitute formal advice. For this reason, any individual should, before acting, consider the appropriateness of the information, having regard to the individual’s objectives, financial situation and needs and, if necessary, seek appropriate professional advice.

