

2018 has been a disappointing year for investors with the market (as measured by the benchmark S&P/ASX 200) posting an overall loss after dividends of 2.84%. On a relative basis, our model income portfolio underperformed the index by 1.1%, while our growth-oriented portfolio matched the index.
The purpose of these portfolios is to demonstrate an approach to portfolio construction. As the rule sets applied are of critical importance, we provide a quick recap on these.
This is our final Report on 2018. Next week, we will publish our 2019 portfolios, which while based of the 2018 portfolios, will be re-balanced and incorporate some further changes.
Portfolio recap
In January, we made some adjustments to our Australian share ‘Income Portfolio’ and ‘Growth Portfolio’ (see https://switzersuperreport.com.au/our-portfolios-for-2018/).
The construction rules applied were:
- a ‘top down approach’ that looks at the prospects for each of the industry sectors;
- for the income portfolio, we introduced biases that favour lower PE, higher yielding sectors;
- so that we are not overly exposed to a market move, in the major sectors (financials and materials), our sector biases will not be more than 33% away from index. For example, the weighting of the ‘materials’ sector on the S&P/ASX 200 is currently 18.0%, and under this rule, our possible portfolio weighting is in the range from 12.0% to 24.0% (ie plus or minus one third or 6.0%);
- we require 15 to 20 stocks (less than 10 is insufficient diversification, over 25 it is too hard to monitor), and have set a minimum stock investment size of $3,000;
- our stock universe is confined to the ASX 100. This has important implications for the growth portfolio, because the stocks with the best medium term growth prospects will often come from outside this group (the so called ‘small’ caps);
- we avoid stocks from industries where there is a high level of exogenous risk, such as airlines;
- for the income portfolio, we prioritise stocks that pay fully franked dividends and have a consistent record of paying dividends; and
- within a sector, the stocks are broadly weighted to their respective index weights, although there are some biases.
Overlaying these processes are our predominant investment themes for 2018, which we expect to be:
- Synchronised growth in the USA, Europe, China and Japan;
- The US Fed likely to increase US interest rates by 0.75%,
- Interest rates in Australia to remain at historically low levels, with the RBA unlikely to move rates higher until the final quarter of 2018. Some upward movement in bond rates;
- Australian dollar around 75 US cents, but with risk of breaking down if the US dollar firms;
- Commodity and energy prices remaining reasonably well supported;
- A positive lead from the US markets;
- A moderate pick-up in growth in Australia, back towards trend levels; and
- No material pick up in domestic inflation.
Performance
For 2018, the income portfolio is down by 3.94% and the growth-oriented portfolio by 2.92% (see tables at the end). Compared to the benchmark S&P/ASX 200 Accumulation Index (which adds back income from dividends), the income portfolio has underperformed the index by 1.10% and the growth-oriented portfolio by a fractional 0.08%. Both these numbers don’t take into account the impact of franking credits, or the benefits to a low rate taxpayer of participating in off-market share buybacks.

Health Care the big winner, Financials the big loser in 2018
Health Care was the best performing industry sector on the ASX in 2018 with a return of 19.3%. Led by CSL and Resmed, it enjoyed a return to form in December with a gain of 2.9%.
The Financials sector, which is the largest sector by market weight with a weighting of 32.6%, has been battered by the fallout from the Royal Commission into Misconduct in the Banking, Superannuation and Financial Services Industry. It suffered a loss of 3.1% in December taking its yearly loss to 9.7%.
Communication Services was another standout sector, losing 5.1% in the month and 17.9% for the year as competition in the mobiles market and the NBN roll-out took its toll.
Individual sector returns (for the month of December and calendar year 2018) are set out in the table below.
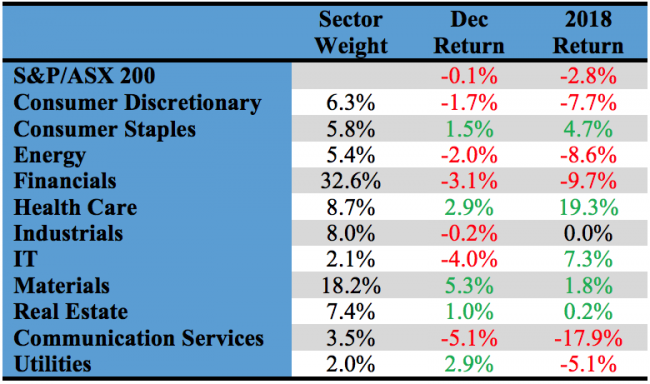
One interesting feature of 2018 has been the relative outperformance of the top 20 stocks and underperformance of the midcaps and small caps. Following a horror December quarter, the Small Ordinaries index posted a loss for the year of 8.7% and the MidCap 50 index a loss of 7.4%. By comparison, the top 20 finished with a small loss of 0.4%.
Income portfolio
On a sector basis, the income portfolio is moderately overweight financials and index-weight materials. Exposure is being taken through the major banks (to the former), and the major miners (to the latter).
It is underweight health care, consumer staples and real estate.
It was forecast to generate a yield of 5.13% franked to 88.8%. Due to some mid-year portfolio changes and higher realised dividends, it has generated a yield in 2018 of 5.43% franked to 89.7%.
In December, the portfolio posted a small positive return of 0.33%.
Overall in 2018, it has returned -3.94% and underperformed the accumulation index by 1.10%. This was largely due to its overweight position in financial stocks and underweight position in health care. The return doesn’t take into account the high level of franking credits, nor the benefits low rate taxpayers will have enjoyed from participating in the off-market share buybacks conducted this year in RIO and BHP.
The income biased portfolio per $100,000 invested (using prices as at the close of business on 31 December) is as follows:
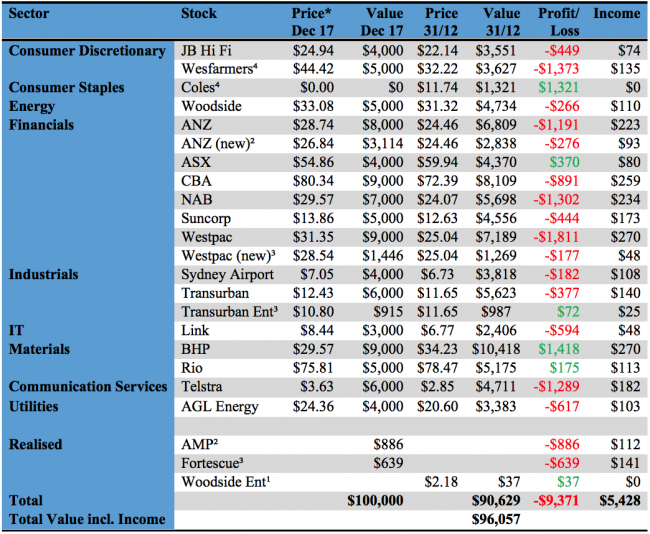
* Closing price 29/12/17
¹ Woodside 1:9 entitlements at $27.00 per share. Assume sold on last day of trading.
² AMP shares sold on 30 April @ $4.04, loss of $886 realised. Balance of $3,114 invested in ANZ @ $26.84
³ Fortescue shares sold on 31 August @ $3.84, loss of $639 realised. Balance re-invested in Transurban Entitlement issue (10 for 57 @ $10.80) and $1,446 Westpac @ $28.54.
⁴ Coles demerged from Wesfarmers on 21/11/18. Until exact proportions available, assume $0 cost base for Coles and original cost base for demerged Wesfarmers.
Growth portfolio
The growth portfolio is moderately overweight materials, financials and consumer discretionary. It is underweight consumer staples, industrials and real estate. Overall, the sector biases are not strong.
The stock selection is marginally biased to companies that will benefit from a falling Australian dollar – either because they earn a major share of their revenue offshore, and/or report their earnings in US dollars.
In December, the growth portfolio lost 0.52% as some of the mid cap stocks such as Aristocrat Leisure, Seek, Orora and Challenger came under pressure. For the year, it returned -2.92% which matched the overall index return of -2.84%. The former doesn’t take into account the benefits low rate taxpayers will have enjoyed from participating in the off-market share buybacks conducted this year in RIO and BHP.
Our growth-oriented portfolio per $100,000 invested (using prices as at the close of business on 31 December 2018) is as follows:
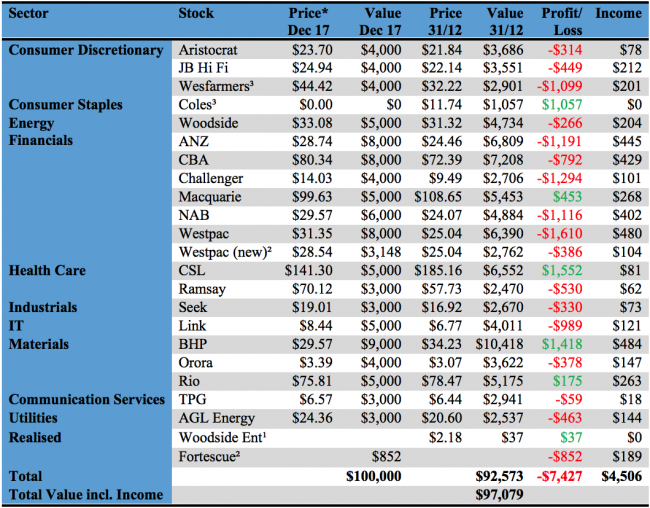
* Closing price 29/12/17
¹ Woodside 1:9 entitlements at $27.00 per share. Assume sold on last day of trading.
² Fortescue shares sold on 31 August @ $3.84, loss of $852 realised. Re-invested in $3,148 Westpac @ $28.54.
³ Coles demerged from Wesfarmers on 21/11/18. Until exact proportions available, assume $0 cost base for Coles and original cost base for demerged Wesfarmers.
Important: This content has been prepared without taking account of the objectives, financial situation or needs of any particular individual. It does not constitute formal advice. Consider the appropriateness of the information in regard to your circumstances.