

If you are the trustee of a self-managed super fund (SMSF), you are required to manage the monies in accordance with your members’ instructions, whether this is you alone, or with your partner and family. With this responsibility comes an onus to say whether you are doing a decent job or not as an investment manager.
And even if you have outsourced the investment functions to an adviser, you are ultimately responsible for the investment performance. So, how can you determine whether you are cutting it as an investment manager?
One way is to simply compare the fund’s performance to the fund’s investment objective(s). If for example your objective is to deliver a return of inflation plus 3% over a 10 year period, then if your fund has been growing at 6% pa over this period, then give yourself a tick.
The problem with this method is that your objective might be unrealistic. Given the level of risk you are taking, it may be too tough. Conversely, you might have set the bar too low.
A more direct method is to compare your fund’s performance to that achieved by the major industry and retail super funds. After all, if you closed your SMSF, this is where the monies would go. So, how has the industry performed?
Super fund returns in 2020/21
Super funds had a spectacular return in 20/21, thanks to the recovery from the Covid-19 market meltdown. According to industry research group Chant West, it is the strongest return in 24 years and the second highest return since the introduction of compulsory super in 1992. The median return for a growth fund, which it defines as a super fund with 61% to 80% invested in growth assets, was 18%. The range of returns for the growth funds it tracks was a low of 13% to a high of 22.6%.
These are the returns for funds in accumulation phase which are paying tax at 15% on investment income and potentially 10% on capital gains. Funds in pension phase do not pay tax, so their returns should be a little bit higher.
Over three years, the median return for a fund in accumulation is 7.9% pa and for 10 years, it is 8.6% pa. For 15 years, which includes the impact of the GFC, the return drops to 6.5% pa (see Table 1 below).
Table 1 – Median Growth Fund Return to 30/6/21
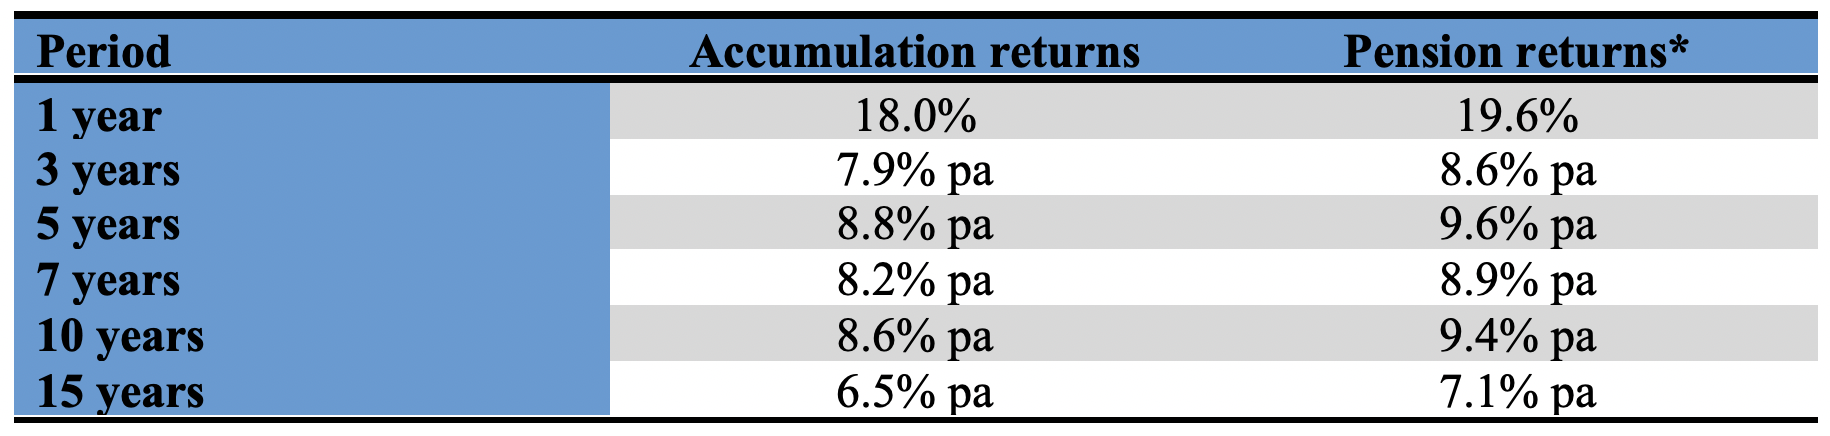
Source: Chant West for Accumulation Returns. Pension returns estimated.
Super investment options are typically classified according to the percentage of growth style assets they target. Growth assets are those where a major part of the return is expected to come from an appreciation in the price of the asset, and includes shares, international shares, property, private equity, infrastructure, commodities and collectables. Income assets are cash, term deposits and interest rate securities such as bonds, mortgages and hybrid securities.
Growth assets will typically deliver higher investment returns, but with more volatility and a higher probability of a negative return. Income assets will typically deliver lower investment returns, but with lower volatility.
Table 2 shows the median returns from 1 year to 15 years (net of investment fees and tax) of different super investment options categorised according to the percentage of growth assets. As you would expect, returns for ‘balanced’ and ‘conservative’ options are lower than the returns for ‘growth’ and ‘high growth’ style options.
Table 2 – Median (Accumulation) Super Fund Returns to 30 June 21
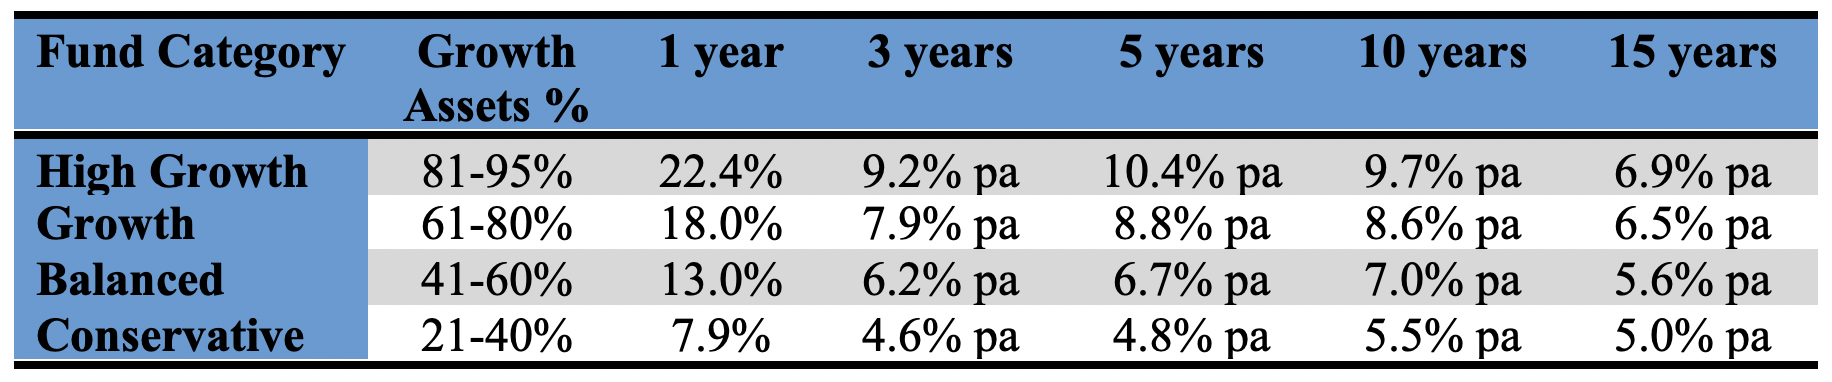
Source: Chant West
Tables 3 and 4 show the returns for Australia’s largest super fund, Australian Super, and its pre-mixed investment options. Table 3 covers funds paying tax (accumulation and transition to retirement or TTR), while Table 4 covers pension funds which are tax free (Australian Super calls these account based pension/Choice Income).
Table 3 – Returns for Australian Super Pre-Mixed Funds (Super and TTR)
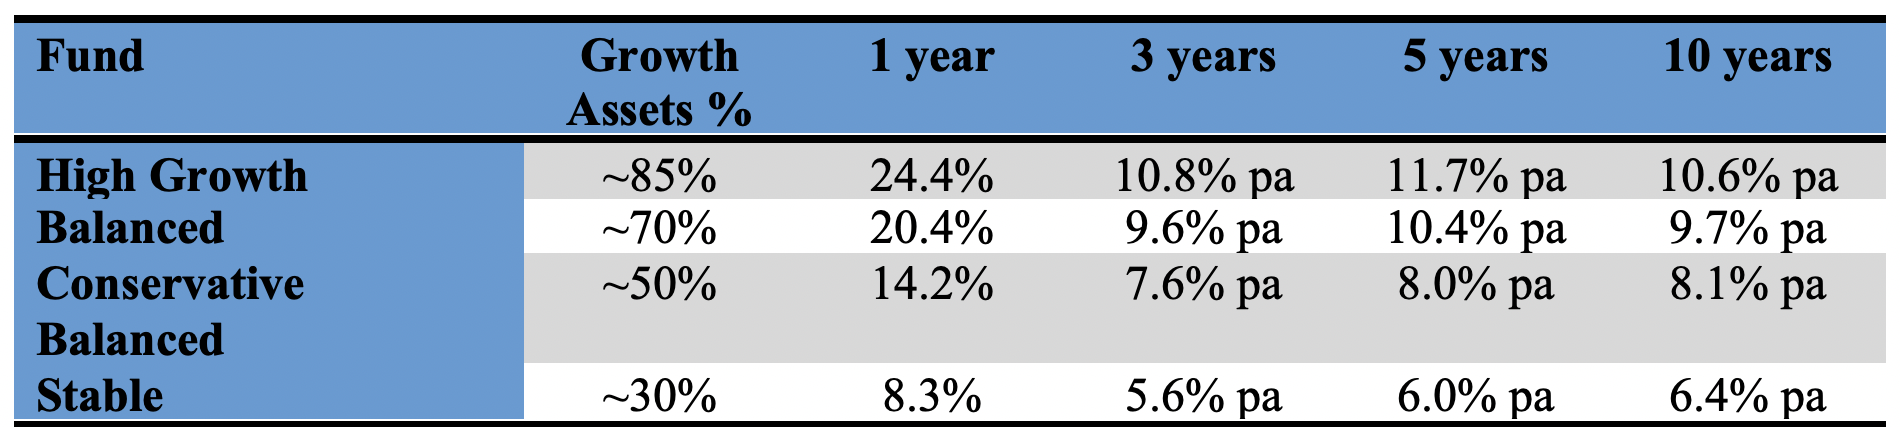
Source: Australian Super, to 30/6/2021
Table 4 – Returns for Australian Super (Account based Pension/Choice Income)
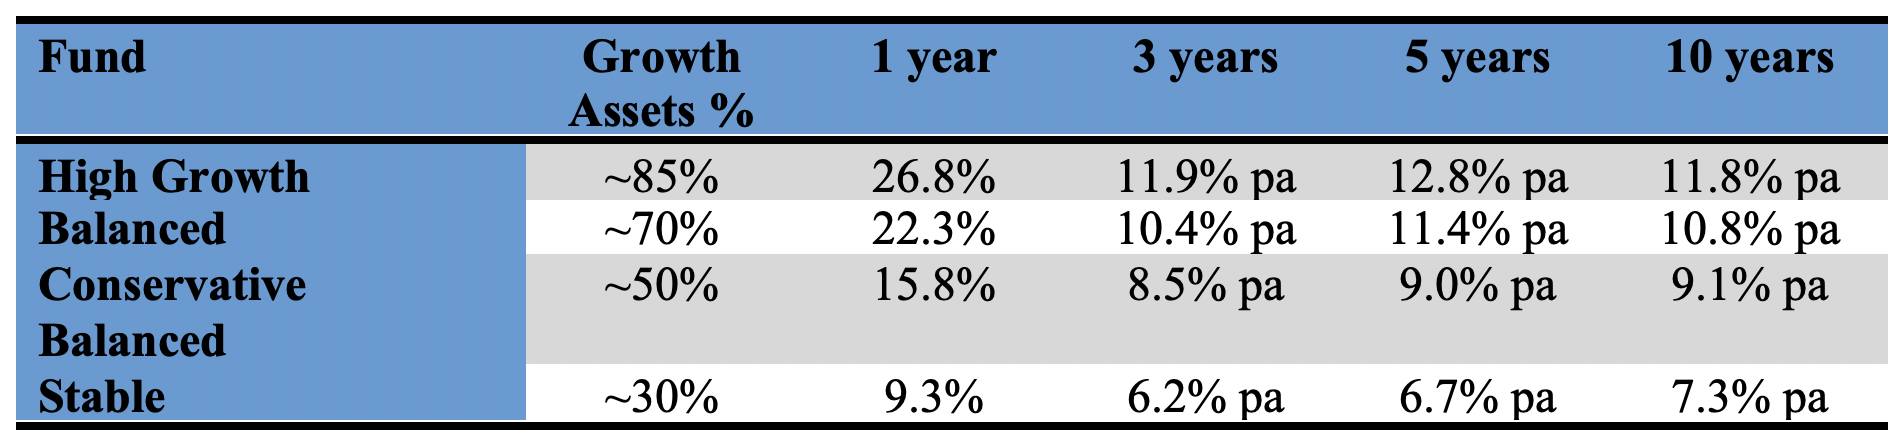
Source: Australian Super, to 30/6/2021
How can you compare? And over what timeframe?
The first step is to categorize your fund (e.g. growth or conservative, super or pension). Whether you use a target asset allocation or the actual allocation on 30 June probably doesn’t matter that much, we are really just after an approximate benchmark.
Next, determine your fund’s performance for the financial year. This usually can’t be done until you have all the tax information and can lodge your annual SMSF return, and may require the help of your accountant or administrator. Most SMSF software packages can calculate investment returns, so don’t be put off if your accountant tries to give you the brush on this. And remember that to compare like with like, we are looking at returns after tax and investment/administration costs. So, if you are doing the calculation manually, don’t forget to add back the franking credit refunds and deduct the administration costs.
What time period? Let’s start with the one year horizon, but clearly no one gets fired for marginal underperformance over such a short period. See if you can extract data for previous years, and compare the returns over 3 years, 5 years and potentially even longer.
What should you do if your performance falls short?
The first task is to understand why you have underperformed. Two potential scenarios are that your mix of growth assets is different to the target or normalized allocation, or secondly, that the individual assets you have selected have underperformed compared to the overall asset class.
Table 5 shows the performance of the major asset classes over the periods to 30 June 21 (sources S&P. Bloomberg, Morningstar, MSCI).
Table 5 – Asset Class Performance to 30 June 21
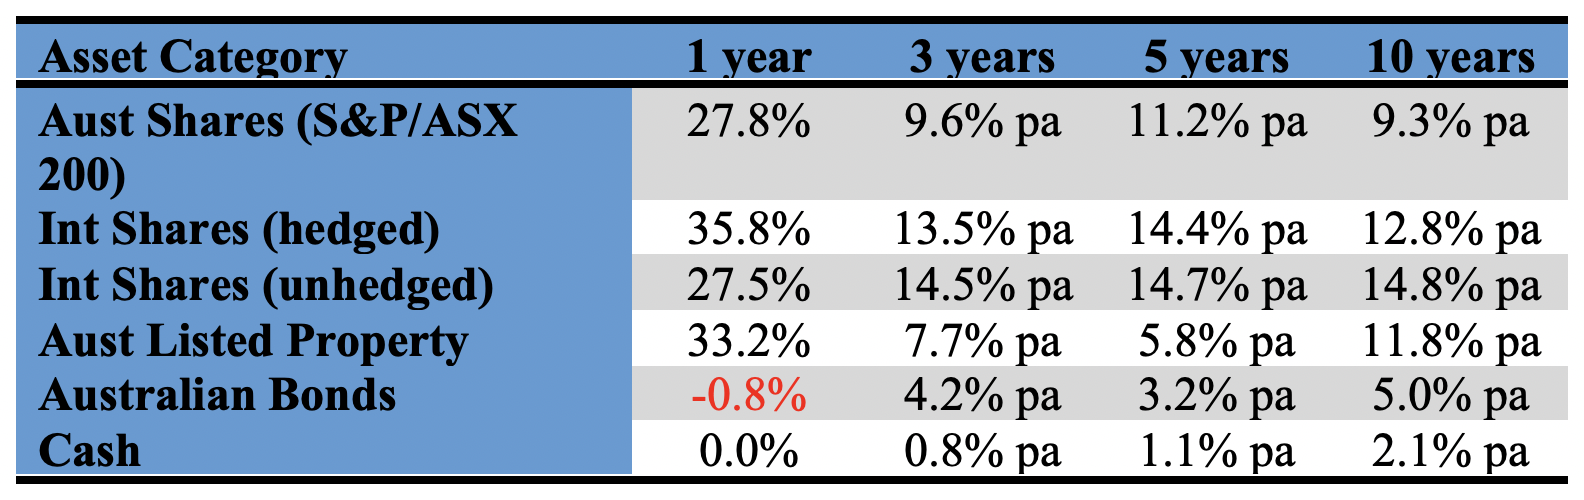
If, for example, your SMSF was underweight international shares, then you may have underperformed over the last few years. International shares have outperformed Australian shares over each of the time periods, with hedged positions (that is where the currency risk is taken out) performing strongly in 20/21. According to Chant West, the typical industry super fund has about 29% of its assets invested in international shares, way higher than the average SMSF.
The other notable standout from the data is the negative performance for Australian bonds in 20/21. This was caused by the move higher in long term interest rates. Over 10 years, the return from bonds at 5.0% pa is considerably lower than the return from shares, but this difference is not inconsistent with what you would expect from a defensive asset.
Just as the performance of asset classes varies considerably, so does the performance of securities or sectors that make up each asset class. Table 6 shows the performance of different components and industry sectors. Returns include dividends, but not the impact of franking credits.
Table 6 – Australian Share market Total Returns to 30 June 21
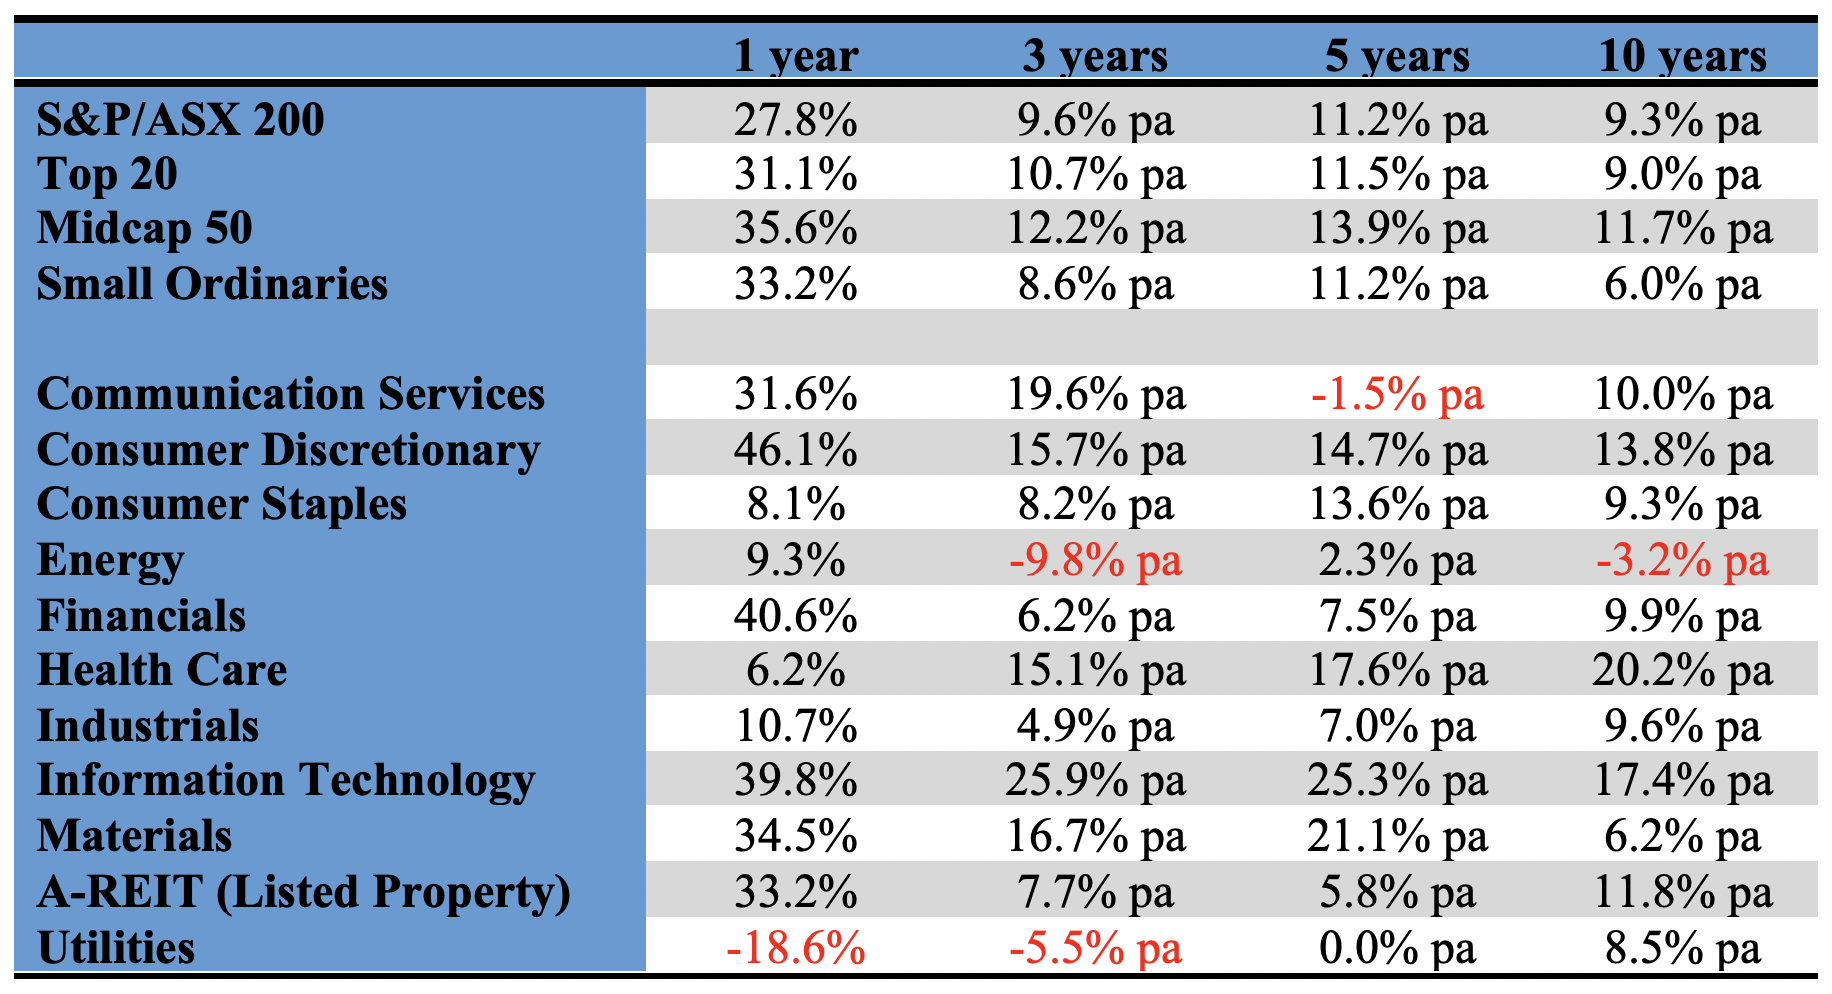
Source: S&P Dow Jones
Many SMSFs, for example, have major holdings in the top 20 companies such as the banks, major retailers, Telstra and miners. While they outperformed (as a group) in 20/21 over 3, 5 and 10 years, they marginally lag the performance of the broader market as represented by the S&P/ASX 200 and have underperformed the Midcap 50 (which comprises stocks ranked 51st to 100th by market capitalization).
The largest sector, financials, was the second best performing sector in 20/21 with a return of 40.6%. It has been a drag in recent years, but thanks to a surge in stock prices and higher dividends, its 10 year return is marginally in front of the overall market.
One key takeout is the consistently strong performance of the healthcare sector (all periods). If your fund has not had any exposure to healthcare leaders CSL, Ramsay, Sonic, Cochlear or Resmed, you may have underperformed. The small but growing information technology sector has also been a strong performer.
Understanding where your SMSF underperformed or outperformed is of course just an input into whether you should make any changes or not. Critically, you need to consider the outlook for the different assets classes/components/sectors going forward. That said, if you are materially underweight or overweight, it may be time to adjust.
And if your performance is consistently falling short?
If you aren’t cutting it as an investment manager, then you should probably wind up your SMSF and transfer your super to an industry fund. Alternatively, engage an adviser to help you. And if you already have an adviser and they aren’t cutting it, fire the adviser.
Important: This content has been prepared without taking account of the objectives, financial situation or needs of any particular individual. It does not constitute formal advice. Consider the appropriateness of the information in regard to your circumstances.