

Lots of our subscribers and financial planning clients are curious about how stocks can keep on rising given the powerful comeback for stocks since late March. And while our S&P/ASX 200 Index only recently reached new all-time highs, the US market has been smashing record highs for months.
Anyone worried about a market crash would look at the US market and think: “Wall Street leads our stock market, so should I brace for a big sell off by cashing out or going very defensive?” To that point, Paul Rickard, Charlie Aitken and yours truly were trumped by a question none of us could answer!
The webinar attendee asked if we’re worried about the Buffett Indicator (BI) and did we know what level it was? Not liking to be beaten by market stuff, I set to work catching up on the BI.
The Corporate Finance Institute explains that it is the Market Cap-to-GDP ratio and is a measure of the total value of all publicly-traded stocks in a country, divided by that country’s Gross Domestic Product. And five days ago Business Insider told us that it hit 200%, which historically is huge! “The Wilshire 5000 Total Market Index climbed as high as $44.3 trillion on Tuesday, while the latest estimate for first-quarter GDP is $22.1 trillion, putting the Buffett Indicator at 200%,” Theron Mohamed of the business website wrote. “That reading is well above the 187% it reached in the second quarter of 2020, when the pandemic was in full swing and GDP was about 12% lower,” he added.
In 2001, the Oracle of Omaha said this indicator was the best when working out the validity of overall market valuations. But that was 2001.
The Buffett Indicator
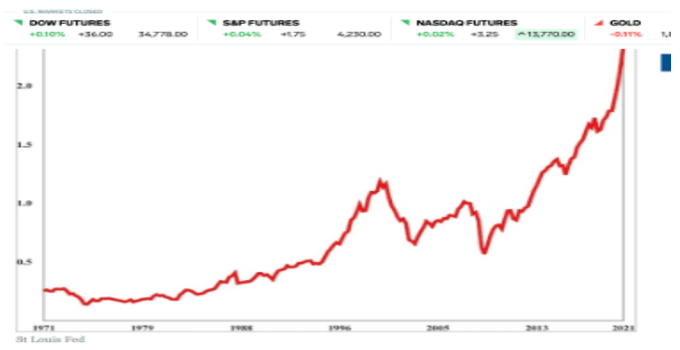
But, as I said, that was 2001! The chart below shows you what interest rates were then, and I’ve used the US Fed Funds Rate to point out the difference from when Warren made his important point about his namesake indicator.
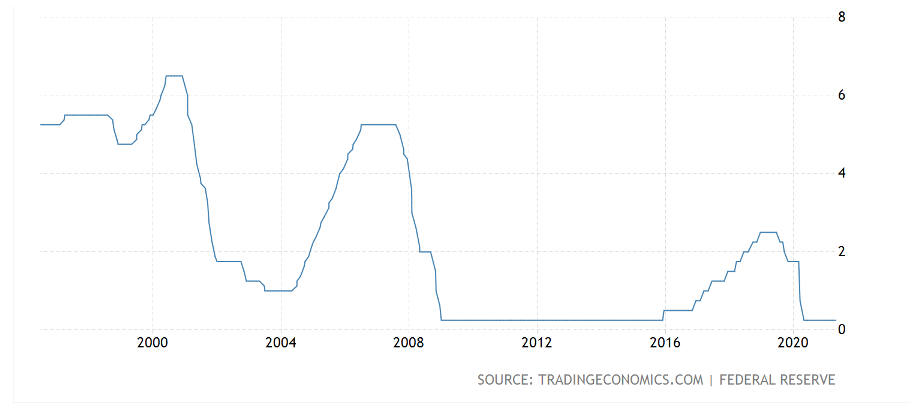
See how the rate was close to 6%. But today it’s close to 0%! Anyone who wants to scoff at someone saying “that this time it’s different”, just show him or her this chart.
It is different and it’s why stocks can keep on rising unless some weird curve ball comes out of left field. Ruling that out, which isn’t always advisable, the big difference now is that governments are spending fiscally like never before. That’s different!
And central banks are telling us that they’ll keep interest rates down for a long time and they keep repeating it. That’s very different too!
And a headline in the AFR adds to my argument that this time things are different. And this is good for stocks. “When will investors realise that central banks are serious this time?”
Karen Maley made the point that even if central banks start taking away the huge supply of money via quantitative easing, it won’t happen until 2022. And it will be gradual to avoid the “taper tantrum” we saw in 2013 when the Fed started cutting back on its stimulus.
Percy Allen in his weekly update reinforced my positive view on stocks, pointing out that we’d had the best fortnight of trading since November. “The share market rose for a third day to complete its strongest back-to-back weekly advance since last year’s US presidential election,” he wrote.
Percy knows how important inflation and interest rates are to where stocks head and his observation keeps me positive: “All one can say at this stage is that the US five-year inflationary expectation rate is rising quickly just as it did after the depth of the 2008-09 recession. But its level is not yet disturbingly high by historic standards.”
Meantime his quite complex analysis of moving averages and market oscillating indices made him give the thumbs up for Aussie stocks both for the short-term and the medium-long-term! “Since the 20th of October, the All-Ords index has been bullish on medium-to-long term trend analysis because its 30-day trend line has been above its 300-day one,” Percy pointed out. “The upturn in the monthly Coppock momentum indicator after October 2020 confirmed the Australian share market crash of February-March (the first crash since 2007-09) was over.”

But wait, there’s more! And it gets back to where I started talking about low interest rates.
Percy says stock market valuations based on P/E ratios suggest the US, though not the Australian stock market, is extremely expensive. “But valuations based on comparing earning yields of shares with those of long-dated government bonds, suggest that both the US and Australia stock markets are extremely cheap. Low inflation and interest rates underpin the latter view.”
If the Fed’s Fund Rate was 6% and the Buffett Indicator was 200 I’d be saying sell or get defensive but it’s 0.25%.
In Friday’s monthly webinar, Charlie Aitken of Aitken Investment Management made the point that vaccination rates are the most important economic indicator to watch. Charlie’s right because it tells us how and when the world economy will open up to normalcy again. A poor vaccination rate will markdown economic forecasts, which could hit stocks. And in contrast, a faster-than-expected jab rate could bring on greater growth, inflation and rising interest rates that could hurt stocks.
At this stage, with interest rates being so low, I think stock markets are on an upward trend, with index dips set to be buying opportunities.
That said, I think central banks and what they do with interest rates will have the biggest bearing on when stocks stop rising.
Important: This content has been prepared without taking account of the objectives, financial situation or needs of any particular individual. It does not constitute formal advice. Consider the appropriateness of the information in regard to your circumstances.