

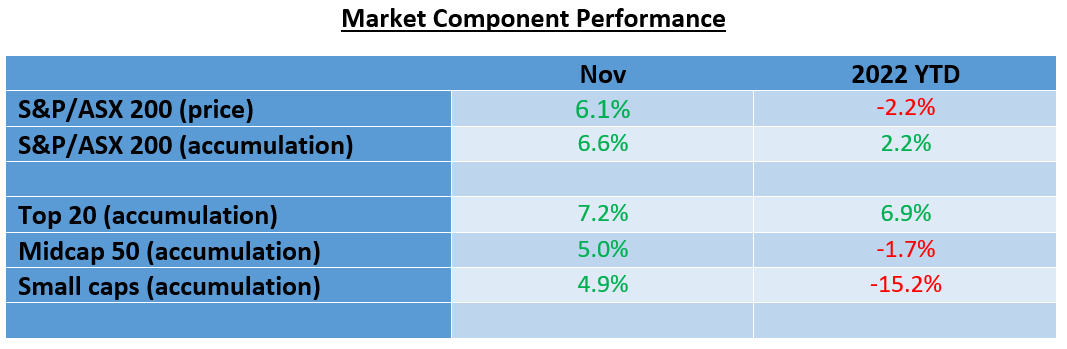
After one of the toughest years in recent memory, the sharemarket has moved into positive territory. A rally of 13.0% in the months of October and November means that the year to date return, including dividends, is 2.2%. In price terms, which excludes dividends, the S&P/ASX 200 is down just 2.2%.
Our model portfolios are doing better than the overall market, and in relative terms, outperforming. This is in part due to their orientation towards major cap stocks and overweight positions in the banks and major miners, and in the case of the income portfolio, no exposure to IT stocks.
There are two model portfolios: an income oriented portfolio and a growth portfolio. The objective of the income portfolio is to deliver tax advantaged income whilst broadly tracking the S&P/ASX 200. With the growth portfolio, the objective is to outperform the S&P/ASX 200 over the medium term, whilst closely tracking the index.
The objectives, methodology, construction rules and underlying economic assumptions for our model portfolios can be referenced here: (see: https://switzerreport.com.au/admajor vice/model-portfolios/ )
These are long-only model portfolios, and as such, they are assumed to be fully invested at all times. They are not “actively managed”, although adjustments are made from time to time.
In this article, we look at how they have performed in 2022. To do so, we will start by examining how the overall market has fared.
Energy and ‘top 20’ stocks lead, technology and real estate get walloped
The broad market as measured by the S&P/ASX 200 Accumulation Index, is up 2.20% for the first eleven months of 2022.
The top 20 stocks, which includes the 4 major banks, Macquarie, Woodside, Woolworths and major miners in BHP, Rio and Fortescue, has outperformed the rest of the market in a relative sense with a return of 6.9%. Midcaps and small caps have fared far worse, with small caps (as measured by the Small Ordinaries Index) shedding 15.2% in 2022.
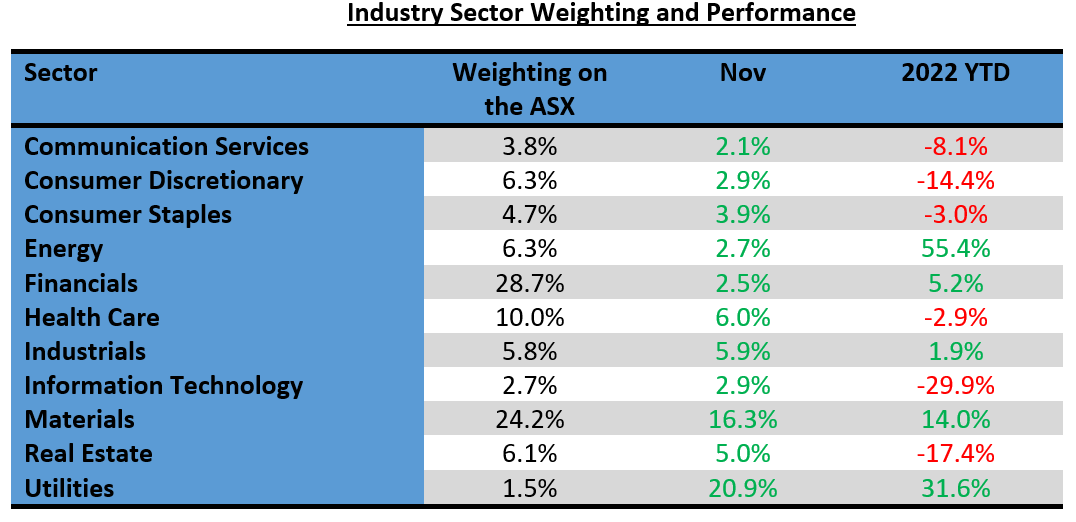
With the industry sectors, the largest sector on the ASX, financials, which makes up 28.7% by weighting, is up by 5.2% this year. Unsurprisingly, energy is the best performing sector with a return of 55.4%. The second largest sector, materials, led the sectors in November with a gain of 16.3% and year to date has delivered a total return of 14.0%.
Information technology is the worst performing sector with a loss of almost 30.0%. Other growth sectors such as health care and consumer discretionary, which tend to trade on higher PE (price earnings) multiple, are also struggling in a relative sense. Consumer discretionary, which is being hit by fears that consumers will reduce purchases of goods, is down by 14.4%. Although improving in October and November, the prospect of higher interest rates has hurt real estate, which is the second worst performing sector with a loss of 17.4%.
The following table shows the performance of the 11 industry sectors for the month of November and in calendar 2022, and their respective weighting on the ASX.
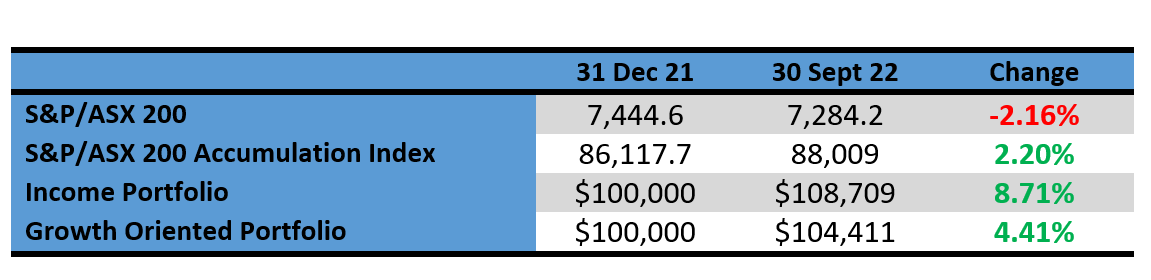
Portfolio Performance in calendar year 2022
The income portfolio to 30 November has returned 8.71% and the growth oriented portfolio has returned 4.41% (see tables at the end). Compared to the benchmark S&P/ASX 200 Accumulation Index (which adds back income from dividends), the income portfolio has outperformed by 6.51% and the growth portfolio by 2.21%.
Income Portfolio
The objective of the income portfolio is to deliver tax advantaged income whilst broadly tracking the S&P/ASX 200.
The income portfolio is forecast to deliver an income return of 4.65% (based on its opening value at the start of the year), franked to 80%. So far, it has delivered 5.11%, franked to 87.3%. With dividends yet to be received from Transurban and APA, it will come out closer to 5.3% for the year.
Year to date, the portfolio has returned 8.71%, outperforming the benchmark S&P/ASX 200 by 6.51%. The performance for 0% and low rate taxpayers will be even higher if they participated in the JB Hi-Fi off-market share buyback. Further, the return does not include the tax benefits of the in-specie fully franked dividend paid by BHP in connection with the distribution of Woodside shares. In a portfolio sense, this potentially boosts the overall return by 0.42%.
The income portfolio per $100,000 invested (using prices as at the close of business on 30 November) is as follows:
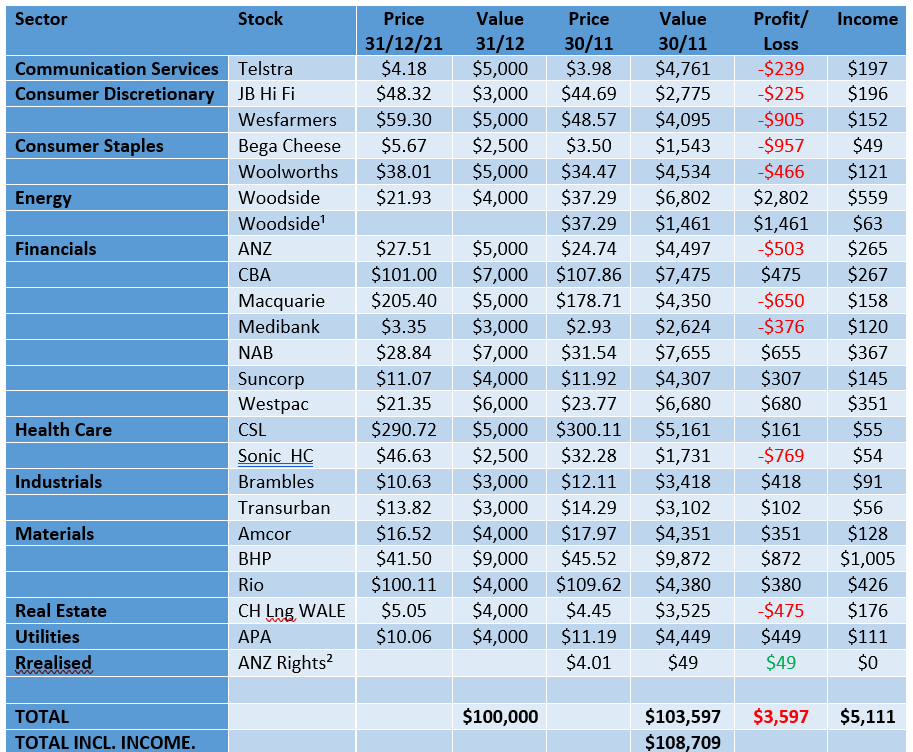
¹ New Woodside shares issued after BHP/Woodside merger of oil assets on a 1:5.534 basis
² ANZ Rights, issued on a 1:15 basis to buy new ANZ shares at $18.90 per share. Assumed to have been sold on the last day of rights trading.
Growth Portfolio
The objective of the growth portfolio is to outperform the S&P/ASX 200 market over the medium term, whilst closely tracking the index.
Year to date, the portfolio has returned 4.41%, outperforming the benchmark S&P/ASX 200 by 2.21%. The performance for 0% and low rate taxpayers will be even higher if they participated in the JB Hi-Fi off-market share buyback. Further, the return does not include the tax benefits of the in-specie fully franked dividend paid by BHP in connection with the distribution of Woodside shares. In a portfolio sense, this potentially boosts the overall return by 0.50%.
Our growth oriented portfolio per $100,000 invested (using prices as at the close of business on 30 November 22) is as follows:
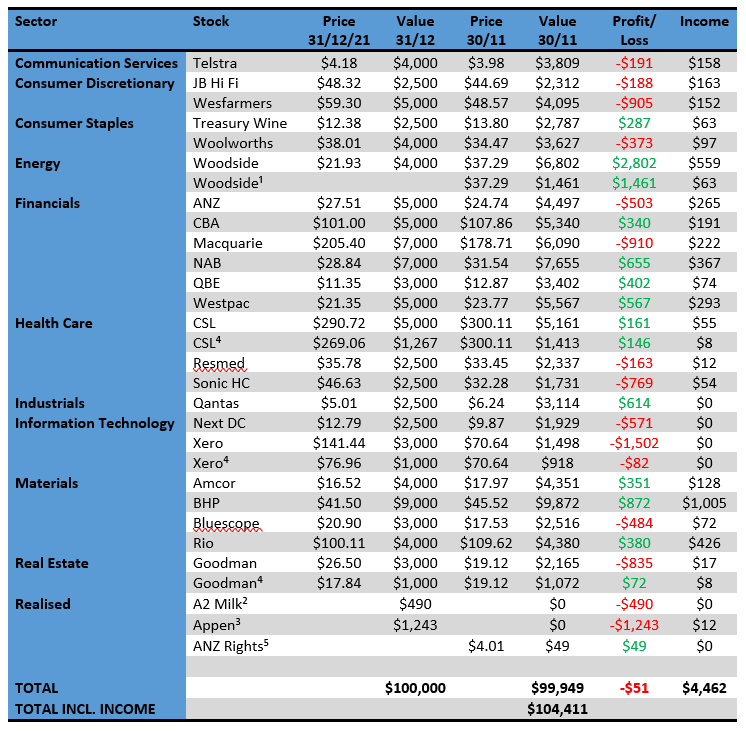
¹ New Woodside shares issued after BHP/Woodside merger of oil assets on a 1:5.534 basis
² A2 Milk sold 30/6 @ $4.39, to realize loss of $490. Original purchase $2,500 @ $5.46
³ Appen sold 30/6 @ $5.61 to realize loss of $1,243. Original purchase of $2,500 @ $11.16
⁴ Purchased 30/6. $1,267 CSL @ $269.06; $1,000 Xero @ $79.96; $1,00 Goodman @$17.84
⁵ ANZ Rights, issued on a 1:15 basis to buy new ANZ shares at $18.90 per share. Assumed to have been sold on the last day of rights trading
Important: This content has been prepared without taking account of the objectives, financial situation or needs of any particular individual. It does not constitute formal advice. Consider the appropriateness of the information in regards to your circumstances.