

Question 1: There have been a couple of reports in the media about IAG’s exposure to the troubled Greensill group. Last Friday, IAG;s share price plunged by more than 10% before recovering. What is your view on IAG?
Answer: IAG put out a very strong denial that they had no “net exposure” to Greensill. There may be questions about “gross’ exposure, but on face value, I think you have to take the denial for what it is. This whole Greensill thing is likely to take a long, long time to play out.
I continue to like IAG as a “recovery play”. The new CEO has impressed, insurance margins are on the rise, and investment income could pick up with higher bond yields.
Question 2: I have read that the transfer balance cap for super is being increased by $100,000 to $1.7m from 1 July. I have already rolled over the full amount to pension of $1.6m – does this mean that I can add another $100,000 to my super pension?
Answer: The transfer balance cap governs the amount of money you can have in the pension phase of super. This is the phase of super where the tax rate is 0%. Due to inflation, the cap is being increased to $1.7m on 1 July. The higher limit only applies to people accessing it for the first time. So, If you have already accessed the existing $1.6m, you can’t transfer any more money into the pension phase. No.
If you have partially accessed the cap – for example, you have transferred $800,000 into pension and potentially had room to transfer another $800,000 – there will be a proportionate increase in the cap to around $1.65m.
Question 3: What is your view James Hardie (JHX)?
Answer: The market has been very supportive of James Hardie. I like the company, but note that it is dealing with currency headwinds and is arguably pretty full priced. According to FN Arena, the consensus forecast price is $43.60, about 13.8% above the last ASX price of $38.48. Range is a low of $40.00 to a high of $45.50. Of the major brokers, 4 buy recommendations and 2 neutrals ( no sells). With the Aussie around 78c, James Hardie is trading on a multiple of 29.4 times forecast FY21 earnings and 24.3 times forecast FY22 earnings.
Buy in a pullback.
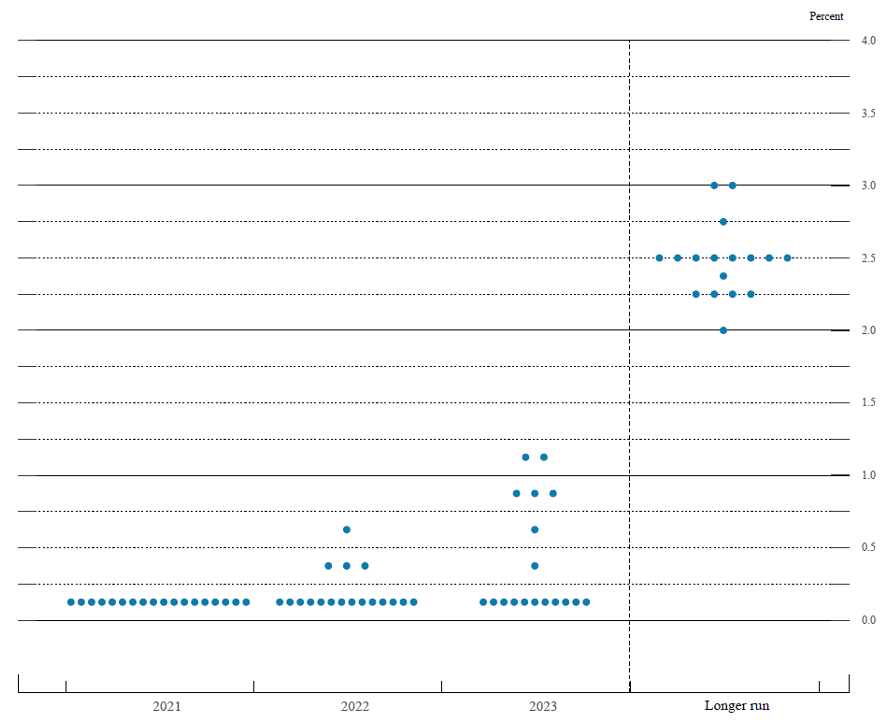
Question 4: What is the US Fed’s “dot plot”, what does it mean and where can I see it?
Answer: At each meeting of the US Federal Reserve Open Market Committee (FOMC) (the rate setting Committee of the US Federal Reserve Board), the 18 members submit their projections on the most likely outcomes for economic growth, unemployment and inflation for the next 3 years and over the long run. They also give their projections of “appropriate monetary policy” for the next 3 years and long term – as expressed by the key short term interest rate. The “dot plot” shows these rates – with each dot representing where a Member sees the rate. The significance is obvious – it tells you where the Members think interest rates will move and over what time. Changes from one meeting to the next are closely watched. At Wednesday’s meeting, although 11 members expect no change in interest rates in 2021, 2022 and 2023, 7 members now expect rates to go up in 2023 – up from 5 at the last meeting.
You can access it at www.federalreserve.gov
Here is the “dot plot”.
Important: This content has been prepared without taking account of the objectives, financial situation or needs of any particular individual. It does not constitute formal advice. Consider the appropriateness of the information in regard to your circumstances.