

Chartists are investors who use graphs of a company’s historical share price to determine its future direction. They look for support and resistance levels and identify patterns, such as head and shoulders, to work out what is going to happen to a stock. For example a head and shoulders – which is really three peaks in a share price – means that if a stock breaks a support level (the neckline of the head and shoulders) its price will probably plummet.
Gary Stone, at Share Wealth Systems, has been charting, which is also called technical analysis, for over 20 years. This week his analysis is pointing him towards Domino’s Pizza Enterprises (DMP).
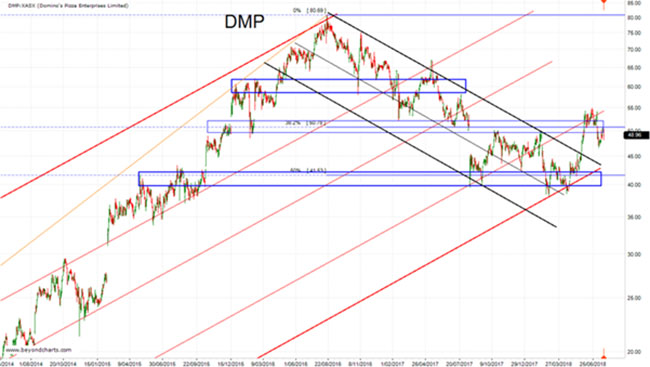
DMP enjoyed a massive 8-year run-up to $80 from $2.50 by August 2016. A strong 50% retracement followed until late May 2018, depicted by the black trend lines, when DMP’s share price broke-out of the down-trending channel. Since then, resistance has expectedly been found in the $50 – $55 area which could lead to DMP retracing back to as far as the upper black channel line. If so, there is strong support in the $39.50 – $41 zone, which has a very high probability of holding fast. However, the odds are that DMP will advance from these levels to test the $50 – $55 area again and if it breaks through that zone, should continue advancing.
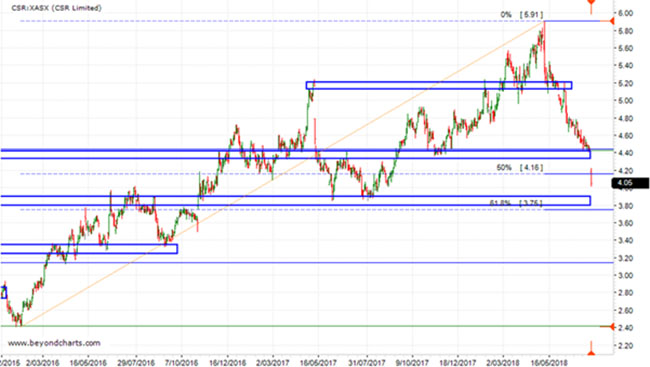
He doesn’t like CSR Limited (CSR) and says the chart (below) says it all.
A strong fall below the $4.30 – $4.40 zone should see continued weakness in the CSR share price for some time to come. Hopefully it finds supports at the next support zone around or just above the $3.75 area.
Important: This content has been prepared without taking account of the objectives, financial situation or needs of any particular individual. It does not constitute formal advice. Consider the appropriateness of the information in regard to your circumstances.