

I am always amazed why someone would pay $1.20 for something that is worth $1.00. But that is exactly what happens when investors choose to invest in some listed investment companies.
I could possibly “get it” if the company owned particularly unique assets, differentiating products, or market-leading intellectual property, but when the company just owns “paper” shares?
I put it down to two main factors – ignorance of what a company’s NTA (net tangible assets) really means and how this compares to the ASX traded price, plus a lack of awareness of other investment alternatives.
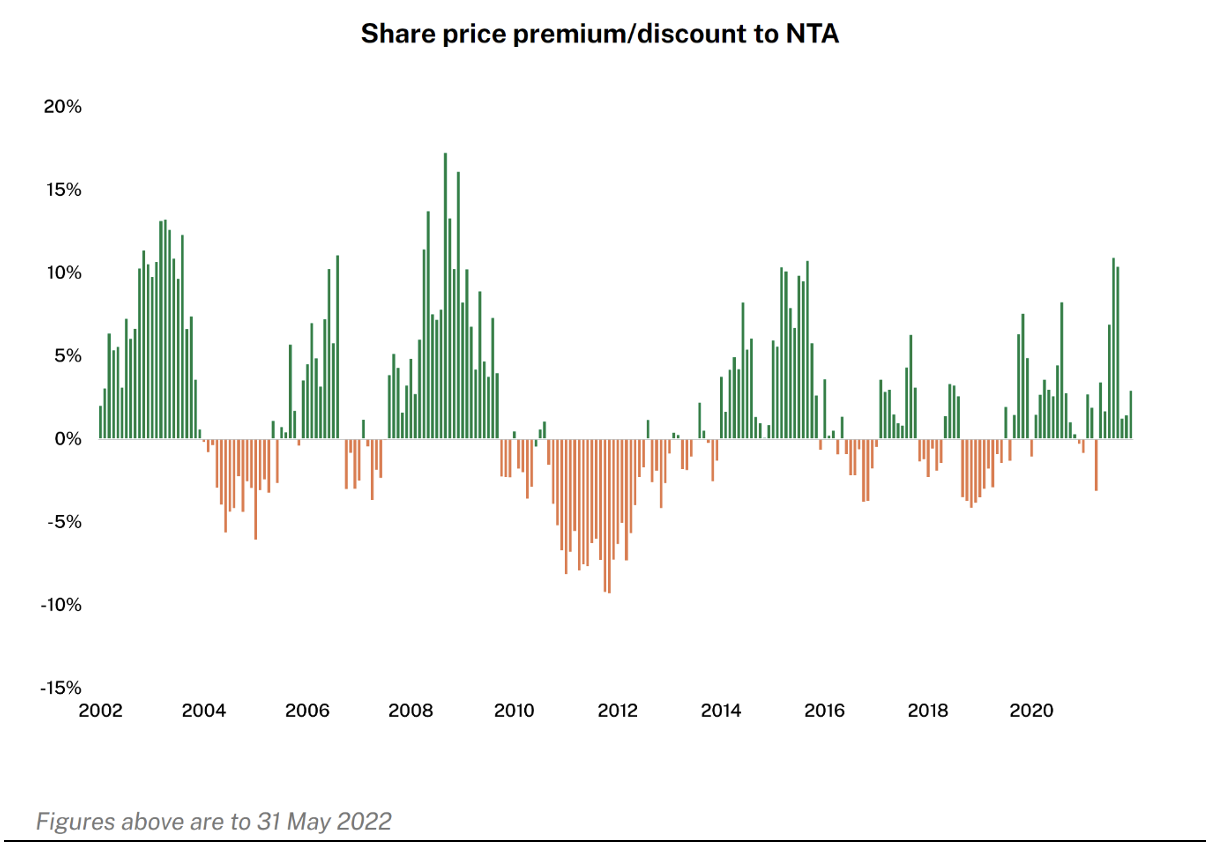
Better performing, more liquid and larger listed investment companies (LICs) tend to trade at a premium to their NTA (that is, the ASX price exceeds the pre-tax NTA). In comparison, poorer performing, less liquid and smaller LICs tend to trade at a discount (the ASX traded price is less than the pre-tax NTA). But NTA premiums tend to be cyclical, as the following long-term chart from Argo Investments (ARG) demonstrates (green is trading a premium, red is trading at a discount). The largest LIC, Australian Foundation Investment Company (AFI), has a similar chart:
Under the ASX listing rules, listed investment companies are required to publish their end-of-month NTA within 15 days of the close of the month. Some LICs do even better, publishing an NTA weekly, and others report on a daily basis.
There are two NTAs – a pre-tax NTA and a post-tax NTA. The latter is an interesting measure that discloses the company’s liability to pay capital gains tax (or not) if it sold all its assets – but as this is not going to happen in practice, it can be ignored.
So focus on the pre-tax NTA. Simply, this is the market valuation of the company’s assets (which are almost exclusively listed company shares), divided by the number of shares on issue – identical to the unit price of a managed fund.
To calculate the premium or discount, take the closing ASX price at the end of the month and compare this to the published pre-tax NTA. For example, Australian Foundation closed on the ASX on 31 May at $8.11. Its pre-tax NTA was $7.14, implying that it was trading at a premium of 13.6%.
If a company doesn’t publish daily or weekly NTAs, they can be estimated during the month. This is pretty easy for the “broad based” LICs that largely invest in blue-chip company shares because historically, their performance closely mirrors the underlying benchmark indices. Considering AFI again, the S&P/ASX 200 accumulation index has given up (lost) 8.75% in June to the close of business on Friday (you can check this on the S&P Dow Jones website). Within a couple of cents, its NTA on Friday was about $6.52. It closed on the ASX on Friday at $7.55, putting it at a premium of about 15%.
Here are three LICs to consider selling and what you could invest in as an alternative. It is possible that the LICs may continue to trade at a premium for some time, and that those premiums may even widen, but on a risk/reward basis, I reckon you are better off “banking” the premium and going elsewhere.
1. Australian Foundation Investment Company (AFI)
Australian Foundation Investment Company (AFIC or AFI, the latter is the ASX ticker code) is Australia’s biggest LIC at about $8.8bn. Its investment objective is to provide shareholders with attractive investment returns through access to a growing stream of fully franked dividends and enhancement of capital invested over the medium term.
AFIC’s portfolio reads like a “top 50” list of companies – Commonwealth Bank, CSL, BHP, Transurban, Macquarie, Westpac, NAB and Wesfarmers are the largest holdings – but there are biases. On a sector basis, it is overweight in financials, healthcare and industrials, and underweight materials and real estate. It has a notable holding in Mainfreight (NZE: MFT).
It benchmarks against the S&P/ASX 200 Accumulation index, but measures performance against the franking adjusted index, which adds about 1.5% to the overall return. Over 5 and 10 years, it has marginally underperformed compared to the index (11.4% pa to 31 May compared to the index’s 11.9% pa for 10 years). It has outperformed over the last 3 years, but in the year to 31 May, it returned 3.5% compared to the index’s return of 6.3%.
Interestingly, its dividend yield is not that attractive. On a prospective dividend of 28c for FY22 and Friday’s closing share price of $7.55, it is yielding 3.7%.
AFIC’s management fee of 0.14% pa (and no performance fees) is one of the lowest for an actively managed portfolio.
At the end of May (see above), it was trading at a premium of 13.8%. By Friday, that premium had blown out to about 15%.
The obvious trade for a holder of AFIC, which is clearly delivering broad share market performance (index), is to sell and invest in one of the index funds, either Vanguard’s Australian Shares Index Fund (VAS) which tracks the S&P/ASX 300 index, or iShares IOZ which tracks the S&P/ASX 200 index.
2. Argo Investments Limited (ARG)
Argo (ARG) is similar in style to AFIC, but not quite as big at $7.1bn. It also boasts an incredibly low management fee of 0.14% pa.
Its objective is to maximise long-term shareholder returns through reliable fully franked dividend income and capital growth. It has a well-diversified portfolio, with the ‘top 10’ in descending order being Macquarie, BHP, CSL, CBA, Rio, Wesfarmers, ANZ, Westpac, Telstra and NAB.
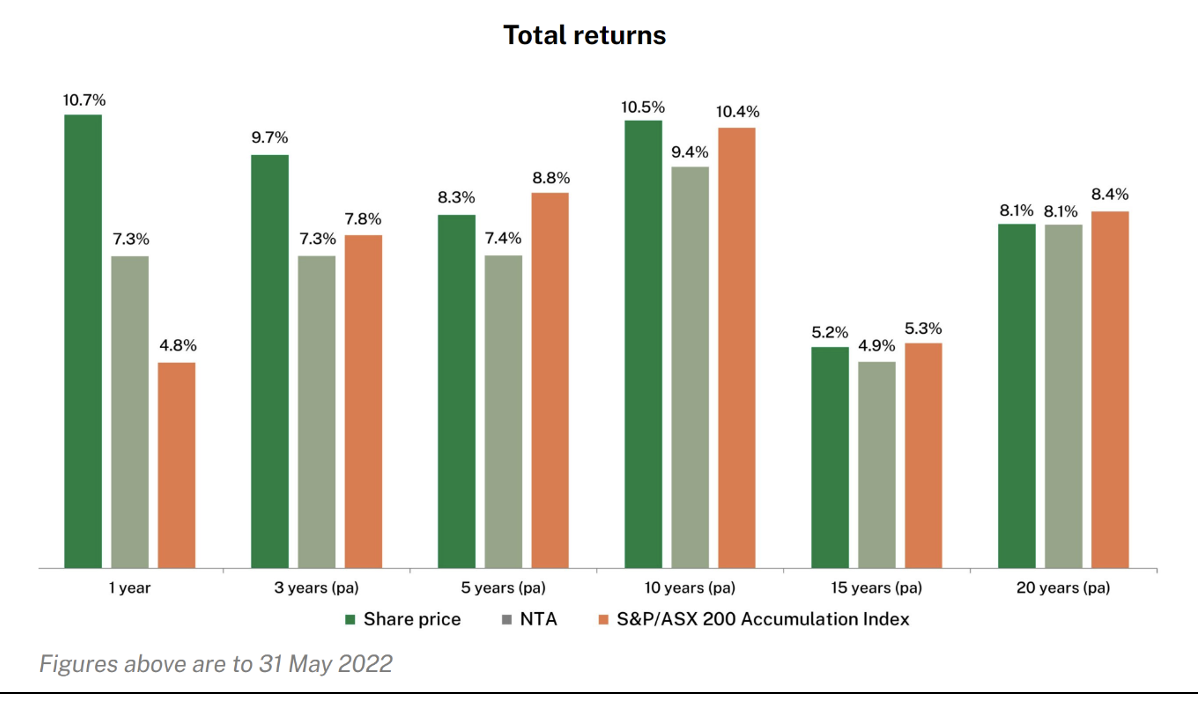
The company benchmarks against the S&P/ASX 200 Accumulation Index. Unsurprisingly, its performance largely tracks the underlying index. Over 20 years, the portfolio performance (as measured by the NTA) is 8.1% pa (olive green) compared to the index’s 8.4% pa (orange). More recently, it has outperformed (in the year to 31 May, 7.3% compared to 4.8% for the index), but has underperformed over 3 years, 5 years and 10 years.
With a prospective full-year dividend of 32-36c per share (Argo paid out 28c for FY21), it is trading on a yield of 3.6-4.0%.
Argo trades at a smaller premium than AFIC. On 31 May, based on a share price of $9.41 and NTA of $9.14, it was 3.0%. On Friday, with a closing share price of $8.95, I estimate it had blown out to about 7.0%.
The trade (when Argo is trading at a premium) is to buy VAS or IOZ.
3. WAM Capital
Wilson Asset Management’s flagship LIC, the $1.7bn WAM Capital Limited (WAM), provides investors with exposure to an actively managed diversified portfolio of undervalued growth companies with a focus on small- to medium-sized businesses.
At the end of May, holdings included names such as ALS (ALQ), Bega Cheese (BGA), Fletcher Building (FBU) Nufarm (NUF), Pendal (PDL), United Malt (UMG), and Virgin Money (VUK). On a sector basis, overweight biases were in consumer discretionary and industrials, and underweight biases were in financials, materials, real estate and health care.
Since its inception in August 1999, WAM’s investment performance has been 15.3% pa. This is 6.8% pa outperformance compared to the All Ordinaries Accumulation Index, and 9.8% pa outperformance compared to the S&P/ASX Small Ordinaries Accumulation Index. If management fees were included (WAM is one of the very few LICs or managed funds that doesn’t include these fees), the performance would be lower, but still very impressive.
However, portfolio performance has waned recently. Over 1 year, 3 years and 5 years it has underperformed compared to the S&P/ASX All Ordinaries Accumulation Index, and over 1 and 5 years, it has underperformed compared to the Small Ordinaries Accumulation Index. For example, in the year to 31 May, the portfolio lost 8.5% compared to a positive return of 4.7% for the All Ords, an underperformance of 13.2%. Again if management fees were included, the underperformance would be worse.
On 31 May, WAM was trading at $2.09, putting it on a massive premium of 25.9% to its NTA of $1.66. On Friday, having gone ex-dividend of 7.8c during the month, WAM was trading at $1.725.
If you sell WAM, what to buy? This is more difficult because it operates in a niche of the market less well serviced by other ASX-listed funds. My best guess is probably to look again at VAS or IOZ or invest directly.
Important: This content has been prepared without taking account of the objectives, financial situation or needs of any particular individual. It does not constitute formal advice. Consider the appropriateness of the information in regards to your circumstances.