As a journalist and editor, I’ve covered Australian small-cap stocks for more than three decades. I can’t recall a time when small caps were so out of favour for so long.
Over one year, the S&P/ASX Small Ordinaries Index, a measure of stocks listed 101-300 by capitalisation, is down 4.41% (on a total-return basis, including dividends).
Over three years, the Small Ords has an annualised return of about -1.3%. In contrast, the S&P ASX 100 has an annualised return of 7.2%, S&P data shows. Simply, small-caps have massively underperformed large-caps.
Of course, there are always star small caps within the Small Ords. But in aggregate terms, investors were much better off sticking with large caps.
The performance gap between large-cap and small-cap stocks has widened over the last three years, as Chart 1 below shows.
Chart 1: ASX 100 (blue line) versus Small Ordinaries (white line)
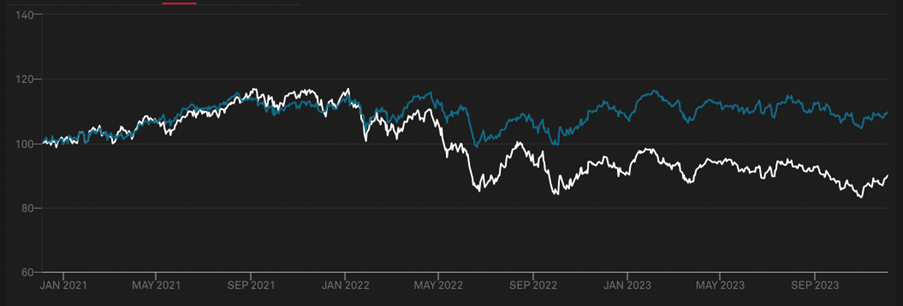
Source: S&P Global
This gap is best reflected in the large discount of small-cap industrial stocks against large-cap industrials. At times this year, small-caps have traded at more than a 20% discount to large-caps (based on aggregate Price Earnings ratios).
Small-caps should trade at a discount because some have lower-quality franchises, fewer financial resources and less share liquidity. But a 20%-plus discount for small-caps (relative to large-caps) is large by historical standards.
Small-cap bulls argue the size of the discount is an opportunity. If you believe in buying assets when they are horribly out of favour, now is the time for small caps.
The trouble is some small-cap bulls have been saying this for the past two years. Having an overweight position in the small-cap asset allocation in portfolios over the past three years has destroyed capital.
Risk aversion is the usual explanation for this small-cap underperformance. In a jittery market, capital favours large-cap stocks that have higher liquidity. Mid-, small- and microcap stocks do better when risk appetite returns.
There’s truth in this cyclical argument. But I wonder if structural factors are also contributing to a larger discount in small-cap stocks.
For example, the rise of Exchange Traded Funds (ETFs) has worked against small and microcap stocks that are outside the main equity indices (by capitalisation).
Growth in private equity has created more options for companies to stay private for longer – or be privatised if they are listed on exchanges. The result: fewer high-growth small-cap companies coming to market through Initial Public Offerings (IPOs)
The contraction of broking research, investment newsletters and investment magazines that cover small-cap stocks is another factor. Less coverage and promotion of small caps means less investor interest and liquidity.
This feels like a different market for small-cap stocks compared to five or 10 years ago, such is the lack of interest in small-caps generally.
But this indifference fuels opportunity. As fewer people cover small caps, there is greater potential for pricing inefficiencies. As inflation falls – and the market looks to rate cuts rather than rate rises – small-caps could roar back to life in 2024.
It’s no surprise that some asset managers have launched small cap funds this year to attract capital from asset allocations of investors who recognise the opportunity.
Although small-caps have plenty of headwinds, there’s a case for a cautious increase in small-cap asset allocations within portfolios. Few investors ever pick the precise turning point in markets, but it’s close enough for small caps at current aggregative valuations.
As a stock picker’s market, small cap investing favours active managers that can pinpoint the best opportunities. Australia has some terrific active small-cap managers that have unit trusts, active ETFs or Listed Investment Companies.
However, when assets are out of favour, it can pay to use ETFs for broad-based index exposure. These ETFs enable investors to ‘buy the sector or market’ and position for recovery and outperformance over the next few years.
Investors can hold small-cap ETFs in their portfolio core and individual small-cap stocks they favour as portfolio satellites.
Here are two favoured ETFs – one local, one global – for small-cap exposure.
1. Vanguard MSCI Australian Small Companies Index ETF (ASX: VSO)
With $741 million of assets under management. VSO is the largest small-cap ETF on ASX – and a good choice for investors seeking small-cap exposure.
VSO held 194 companies (at end-October 2023) in the MSCI Australian Small Companies Index. About a quarter of VSO is invested in the materials sector, followed by industrials at about 15% and consumer discretionary at 13%.
VSO has some large stocks (that are technically outside the top 100). The ETF’s median market capitalisation is about $3 billion.
VSO’s largest holdings are Carsales.com (a favourite of this column), Lynas Rare Earths, Evolution Mining, AGL Energy and Whitehaven Coal. Atlas Arteria, NEXTDC (another favourite), Worley, Allkem and Incitec Pivot round out the top 10.
At end-October 2023, VSO was on a trailing Price Earnings (PE) ratio of 13.5 times and price-to-book ratio of 1.6 times. Both valuation metrics appeal.
On performance, VSO has returned -8.35% over six months to end-October 2023. Like other small-cap index funds, it’s had a tough time in an out-of-favour asset.
Bought and sold like a share on ASX, VSO is a convenient, low-cost tool for investors seeking exposure to a small-cap recovery. The annual fee is 0.3%.
Chart 2: Vanguard MSCI Australian Small Companies Index ETF
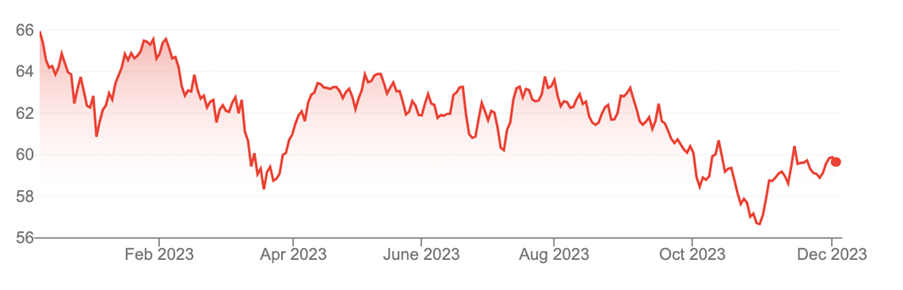
Source: Google Finance
2. iShares S&P Small-Cap ETF (ASX: IJR)
Most Australian investors focus on local rather than global small-cap stocks. But global small and mid-cap stocks could be a better opportunity.
Small-cap bulls will note sharp gains in the Russell 2000 Index, a key barometer of US small-cap stock performance, in the past month. The bulls argue that US small-cap gains are a portent of things to come in Australia next year.
The iShares S&P Small-Cap ETF is among the few ASX-quoted ETFs that provide global small-cap exposure.
IJR provides exposure to the S&P Small-Cap 600 Index in the US. By market capitalisation, stocks range from just below US$1 billion to above US$5 billion.
I favour IJR for a few reasons. First, the US is ahead of Australia in the fight against inflation and in its interest-rate cycle. My bet is US small-caps will recover well before Australian small-caps (that trend could be underway now).
Second, I like the US for small-cap exposure. Among developed nations, the US has better prospects for growth in 2024. I expect the US to avoid recession and engineer a ‘soft landing’ – an unthinkable result a year ago.
Third, IJR was on a trailing PE of just 10.7 times at end-October 2023. The ETF’s average price-to-book ratio was 1.45 times. If small caps are cheap in Australia, they are even cheaper in the US (based on aggregate valuation metrics).
Fourth, IJR was down 3.23% over one year to end-November 2023. The ETF lost 10.32% in calendar year 2022, continuing a painful stretch of poor returns.
But IJR has a history of strong performance after a calendar year of weak performance. Over five years, IJR has returned -10.32% (2022), 34.01% (2021), 1.13% (2020), 22.68% (2019) and 1.61% (2018). If that pattern persists, IJR should be on track for a better 2024.
IJR is unhedged for currency movements, meaning prospective investors need a view on the Australian dollar versus the Greenback. The annual fee is a low 0.07%.
Chart 3: iShares S&P Small-Cap ETF (ASX: IJR)
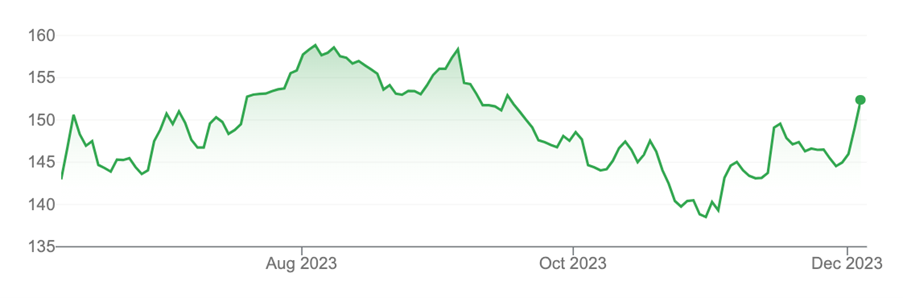
Source: Google Finance
Tony Featherstone is a former managing editor of BRW, Shares and Personal Investor magazines. The information in this article should not be considered personal advice. It has been prepared without considering your objectives, financial situation or needs. Before acting on information in this article consider its appropriateness and accuracy, regarding your objectives, financial situation and needs. Do further research of your own and/or seek personal financial advice from a licensed adviser before making any financial or investment decisions based on this article. All prices and analysis at 6 December 2023.