A chorus of commentators say it’s time to invest more in emerging markets (EMs). Typically, EM assets outperform during US-dollar weakness.
I made a similar point for the Switzer Report last year. In December 2022, I argued that US inflation had peaked, that the pace of US interest-rate rises would slow and that the US dollar would fall gradually in 2023. That has been the case so far.
In March, US inflation fell to its lowest level in two years (but is still stubbornly high). Markets expect a final US rate rise in May, then steady rates for the rest of 2023.
The US Dollar Index is down about 10% from its November 2022 level. Markets are pricing in lower inflation and eventual rate cuts.
As I wrote late last year, I expect the US dollar to grind a little lower this year and so prefer currency-hedged investments (for Australian-based investors in their global equities portfolio allocation).
Separately in December 2022 in this Report, I nominated several contrarian ideas for 2023 using Exchange Traded Funds (ETFs). They included emerging markets (iShares ASIA 50 ETF), gold bullion (BetaShares Gold Bullion ETF), big tech (Global X FANG+ ETF) and small-cap Australian equities (S&P/ASX Small Ordinaries Fund).
Big tech has been the standout from that list. The Global X FANG+ ETF was up 40.8% year-to-date (to end-March 2023), after heavy falls in 2022. Separately, I still like the outlook for gold bullion, small-cap Australian equities and EMs.
In December, I wrote: “As bleak as it looks now, Asian equities could attract foreign fund flows as signs emerge that the US Fed will slow the pace of rate rises. Expectations that China will loosen its tough COVID-19 elimination policy would be another boost.”
I’ve become more bullish on China this year for two reasons. First, China’s economy looks to be stabilising after a turbulent period. Inflation there is relatively low compared to most developed economies. Second, Chinese equities look relatively more attractive compared to US equities.
The iShares China Large-Cap ETF (ASX: IZZ), a barometer of 50 of the largest Chinese companies listed in Hong Kong, traded on an average Price Earnings (PE) multiple of 11.1 times and a Price-to-Book (P/B) ratio of 1.34 times in early May.
In contrast, the iShares Core S&P 500 ETF (IVV), which provides exposure to the 500 largest US stocks, traded on a PE of 20.4 times and P/B of 3.82.
Over three years to end-March 2023, IVV (US stocks) has returned 18.57% on average annually. In contrast, IZZ (China) has an annualised loss of 8.8% over that period.
Simply put, US equities (via IVV) trade on a high average PE, despite signs of slower corporate earnings growth and rising recession risk.
In contrast, Chinese equities have underperformed their US peers and trade on a substantially lower average PE, despite signs of stabilisation in China’s economy this year.
Of course, US equities should trade at a significant premium. US companies, generally, are better governed, benefit from more transparent equity markets, and have far lower geopolitical risk (regulatory risk has been a big threat to investors in Chinese equities).
Nevertheless, there’s a case to reduce portfolio asset allocations slightly to US equities and increase EM exposure, principally to China.
Don’t get me wrong: I’m not suggesting radical portfolio changes. Rather, I’m making the case that US equities look expensive and Chinese equities look undervalued. A higher allocation to China in the EM allocation appeals.
For most investors, EMs should only ever have a small portfolio allocation. Spreading that exposure across EMs, including China, makes sense. So, we’re talking about a fraction of the portfolio with this China idea.
Caveats aside, here are two ways to get China exposure:
- VanEck FTSE China A50 ETF (CETF)
As its name suggests, CETF provides exposure to a diversified portfolio of China’s 50 largest companies in the mainland Chinese market. That makes CETF Australia’s only dedicated China-A share market benchmark exposure.
About a third of CETF is invested in consumer staple companies, meaning it provides useful exposure to China’s high domestic consumption growth. About a quarter of CETF is invested in financials. Only 1% of CETF is in China’s real-estate sector.
CETF has fallen from $80 a share in early 2021 to $55.53 now. The country’s previous COVID-19 elimination policy, real-estate problems and regulatory crackdowns weighed on its equity market. Low economic growth (by China’s standards) was a headwind.
In performance terms, CETF has done nothing for five years. Its average annualised return during that period is barely positive (0.77% to end-March 2023).
CETF’s exposure to mainland Chinese equities (through China-A share market exposure) gives the ETF a higher risk profile. But it also provides greater scope for opportunities for experienced investors who understand the risks of this market.
Chart 1: VanEck FTSE China A50 ETF (CETF)
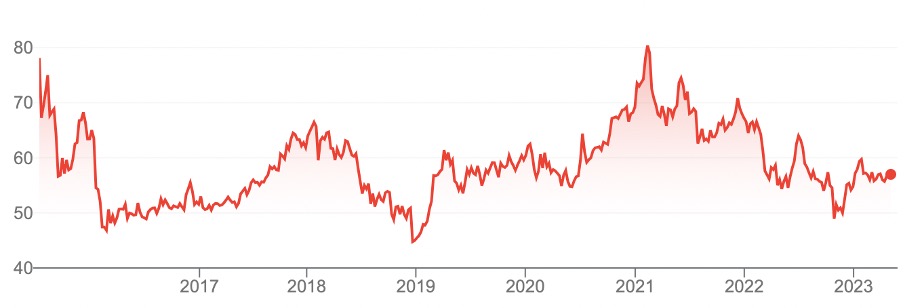
Source: Google Finance
- iShares China Large-Cap ETF (ASX: IZZ)
I initially preferred the iShares Asia 50 ETF to gain more diversified exposure to the region. As I have become more positive on Chinese equities, I’m seeking targeted exposure.
As mentioned, the iShares Large-Cap ETF provides exposure to 50 of the largest and most liquid Chinese companies listed in Hong Kong.
Australian investors will be more familiar with Chinese companies in this index. Its top weightings include Alibaba Group Holdings, Tencent Holdings and JP.com.
I prefer the risk profile of Hong Kong-listed Chinese companies compared to mainland China shares. Thus, my ETF preference for China exposure is IZZ.
Over five years (to end-April 2023), IZZ has a negative annualised return of -5.54%. After such a long period of poor performance, it’s due for improvement.
China contrarians should also keep an eye on VanEck FTSE China A50 ETF. More signs are emerging of improving consumer sentiment in China (higher movie ticket sales in China this are an example).
Chart 2: iShares China Large-Cap ETF (ASX: IZZ)
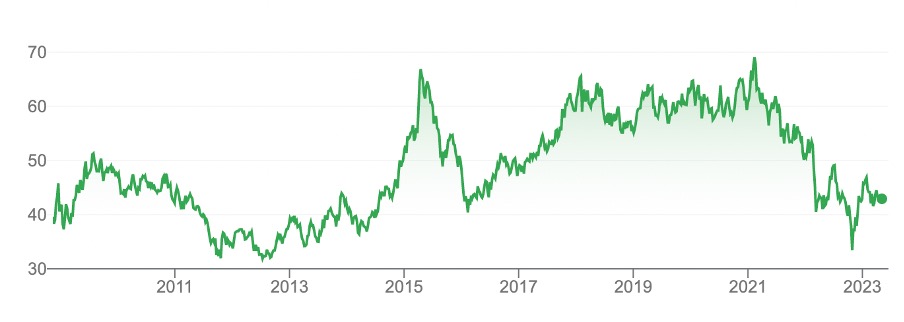
Source: Google Finance
Tony Featherstone is a former managing editor of BRW, Shares and Personal Investor magazines. The information in this article should not be considered personal advice. It has been prepared without considering your objectives, financial situation or needs. Before acting on information in this article consider its appropriateness and accuracy, regarding your objectives, financial situation and needs. Do further research of your own and/or seek personal financial advice from a licensed adviser before making any financial or investment decisions based on this article. All prices and analysis at 3 May 2023