The term “Dr Copper” is a misnomer in this market. The doctor, of course, refers to copper’s supposed “PhD in economics”, which commodity traders jokingly awarded to the metal for its ability to predict economic trends.
Copper has widespread application across industry. Rising copper demand (reflected in a stronger copper price) is seen as a leading indicator of stronger global economic growth.
That’s the theory. The reality is the International Monetary Fund (IMF) this week cut its global growth forecast to 2.8% in 2023, from 3.4% a year earlier. In its latest World Economic Outlook, the IMF warned that deeper financial turmoil, high inflation and interest rates, and the Russia-Ukraine war would slam growth. The report made sombre reading.
The good news is the IMF tips global economic growth to bottom this year, before rising to 3% in 2024. At best, the recovery is gradual.
Meanwhile, copper has rallied over the past three years and is up 8% year-to-date, as Chart 1 below shows. So much for the relationship between copper and global growth.
Chart 1: Copper price (per pound, in USD terms)
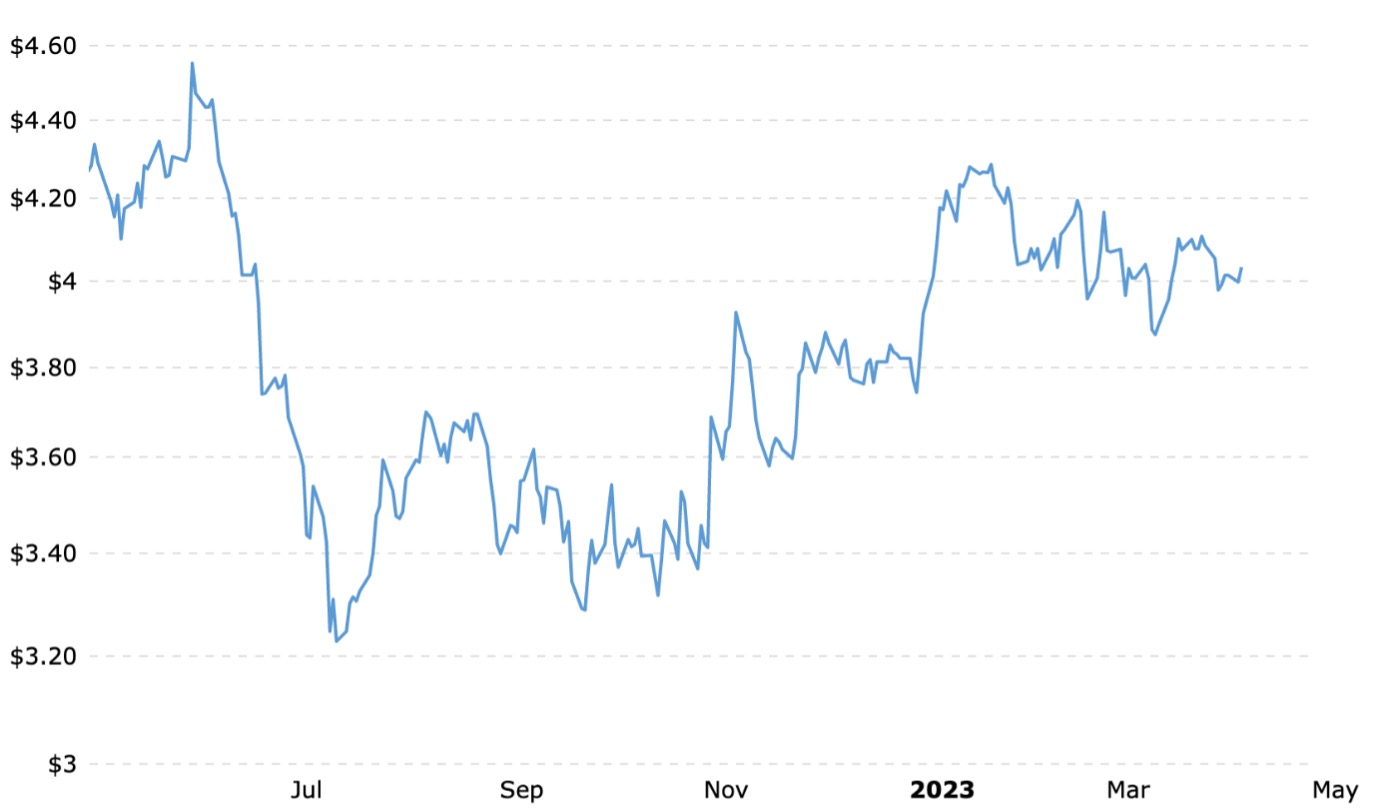
Source: MacroTrends
The copper-price rally reflects two megatrends that have years to play out. One is well known in the market; the other is still underappreciated by investors.
The well-known trend is the renewables boom. Copper is a key raw material in everything from Electric Vehicles (EVs) to wind turbines and solar panels.
S&P Global, a ratings house, last year predicted global copper demand would double by 2035 due to decarbonisation and the move to clean-energy technologies.
The still-underappreciated trend is copper supply. As the International Energy Agency (IEA) notes, a single copper mine on average takes 17 years to go from discovery to production. Increasing copper supply to meet surging copper demand takes time.
It gets worse. As several CEOs of copper producers have noted, the base metal is becoming harder to find and mine. Newer deposits near the surface tend to have lower grades, forcing companies to mine underground (which is costlier).
Geopolitical risk is another key issue. About half of global copper production in 2020 came from countries classified as “unstable” or “extremely unstable”. Peru, a leading copper producer, has had more violent anti-government protests this year that threaten its mining industry. All this adds to supply complications for copper.
In the background is the market’s obsession with Environmental, Social and Governance (ESG) factors in capital allocation. As a green metal, copper is far less affected than fossil fuels. But the ESG trend is affecting all mineral production in one way or another, as mines take longer to be approved and commissioned, and there is more opposition.
Given the expected copper demand-supply imbalance, it’s no wonder mining giants, such as BHP Group, are pouncing. BHP’s takeover bid for OZ Minerals continues to progress as more governments (where Oz Minerals mines) approve the deal.
I wonder how long other ASX-listed copper plays, such as Sandfire Resources and 29 Metals, will remain independent. ASX has few large/mid-cap copper plays left.
Speculators might punt on the next copper takeover on the ASX. Traders might use copper futures or options that can be accessed through global trading platforms.
I prefer investing in copper companies that provide more leverage to long-term growth in copper demand. Long-term investors have to look overseas for this exposure. The big copper names are in Canada, the United States and parts of Latin America.
A word of caution: commodity prices can be volatile and global investing has currency risk. This idea does not suit conservative investors or those who seek yield.
Caveats aside, here are two ways to play the trend using Exchange Traded Funds (ETF):
- Global X Copper Miners ETF (WIRE)
Launched in November 2022, WIRE was the first copper ETF on the ASX. It tracks the Solactive Global Copper Miners Index.
That index comprises 39 local and global copper companies. Top-10 holdings include Southern Copper Corp, Freeport McMoRan and First Quantum Minerals. The median market capitalisation of companies in the ETF is $3 billion.
About half of the ETF is invested in Canadian, US and Australian copper companies. China accounts for just under 10% of the ETF allocation, by country.
At end-February 2023, WIRE had an average Price Earnings (P/E) ratio of 10.2 times and Price-to-Book (P/B) of 1.6 times. Those metrics are undemanding given long-term prospects for the copper price and copper-company earnings growth.
By ETF standards, WIRE has a higher risk profile. Its holdings can range from 20-40 stocks, meaning there is concentration risk.
Currency risk is another factor. The ETF’s base currency is the US dollar, so prospective local investors must have a view on the Australian dollar versus the greenback.
An annual management fee of 0.65% is relatively high by ETF standards, although typical of global thematic ETFs on ASX.
WIRE had a slightly positive return over one year (in Australian-dollar terms) to April 11, 2023. In calendar-year 2022, WIRE’s underlying index returned 7%. That followed two boom-year (plus 30%) returns in 2021 and 2020.
Clearly, WIRE has had a period of softer returns as the market digests previous gains and factors in growing economic headwinds. That looks more of an opportunity than a threat for long-term investors who believe in copper’s potential.
Investors who include thematic ETFs in their portfolio might consider a small allocation to WIRE. With $29 million of assets at end-February 2023, the ETF has a low profile, even though copper arguably has the best long-term fundamentals of any base metal.
Chart 2: Global X Copper Miners ETF (WIRE)
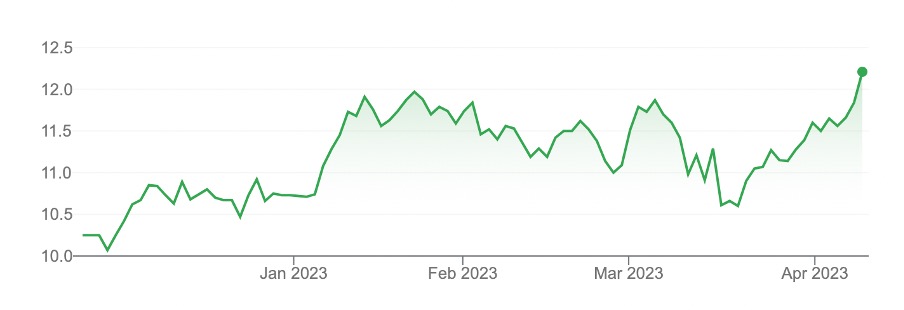
Google Finance
- BetaShares Energy Transition Metals ETF (XMET)
Launched last year, XMET provides exposure to a range of clean-energy metals. They include copper, lithium, nickel, cobalt, graphene, manganese, silver and rare earths.
Investors seeking copper exposure should stick to WIRE. Those who prefer a mix of clean-energy metal exposure, including copper, could consider XMET.
BetaShares doesn’t break down the metals by allocation in its XMET Factsheet. But the ETF’s top-10 exposure shows several copper producers, among them Southern Copper Group, Antofagasta, Freeport McMoRan, Sumitomo Metal Mining Co and OZ Minerals.
By my count (using the top-10 holdings), at least a third of XMET provides copper exposure, probably more if I delved through its entire 36 holdings.
Like WIRE, XMET has concentration and currency risk. Its annual fee is 0.69%. XMET also had a positive return over one year after gains in recent weeks.
Chart 3: BetaShares Energy Transition Metals ETF (XMET)
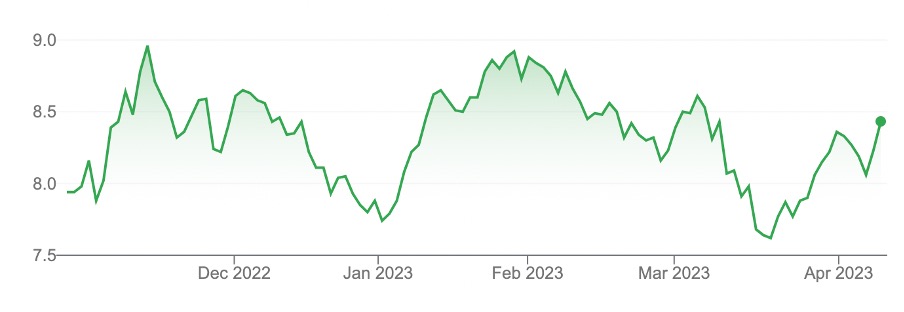
Source: Google Finance
Tony Featherstone is a former managing editor of BRW, Shares and Personal Investor magazines. The information in this article should not be considered personal advice. It has been prepared without considering your objectives, financial situation or needs. Before acting on information in this article consider its appropriateness and accuracy, regarding your objectives, financial situation and needs. Do further research of your own and/or seek personal financial advice from a licensed adviser before making any financial or investment decisions based on this article. All prices and analysis at 29 March 2023.