The US jobs market, which is a bullish indicator for the overall economy, remained strong, with the jobless rate at 3.6%, which is just a tick over the 3.5% number reached before the pandemic hit in 2020. That 2019 unemployment stat was close to a 50-year low, which says a lot about what’s going on in the US despite the ongoing threat of the Coronavirus, the start of a rising interest rate cycle, labour supply problems and general supply chain bottlenecks that are driving up costs and even stifling production.
So while the labour market was strong for the quarter, with average gains of half-a-million jobs a month, the stock market was down for the first quarter in two years!
Before the close, Wall Street was trying to sustain a move into positive territory, after a negative start and this tug-o-war between the negatives of the war, supply issues, rising inflation and rising interest rates versus a fast-growing economy creating lots of jobs, will be the battle that will dominate market direction for the rest of the year.
The bears think the many negatives listed above will hurt company profits, but the bulls believe post-pandemic rebound growth, the consumer starting to spend on services as normalcy reappears, the reaction of business to the rebound of the economy and consumers and sensible central bank interest rate rises, will actually help stocks.
Also, the end of the Ukraine war will bring expected costs linked to energy and transport down, which should also help profits. Of course, it’s a guessing game but we have seen in recent weeks what I’ve been predicting, that if peace happens, stocks will soar.
Overnight, all European stock markets were up and CNBC agrees with my view that the war is a current key determinant of stock prices. “European markets closed higher to start the second quarter on Friday, with talks between Russia and Ukraine continuing to guide investor sentiment,” Elliot Smith reported. “Although volatility is expected to continue until there is more clarity on the geopolitical front, Societe Generale believes investors will come back as soon as the clouds clear.”
And there will be some investors wondering if it’s time to take a punt on peace and a European stock or ETF play. “If we have any better visibility on the situation — [the war] — those investors will come back, and … valuation is very appealing. We are now trading with more than a 30% discount on European equities versus the U.S. This is an all-time high in terms of discount,” Roland Kaloyan of Societe Generale told CNBC’s “Squawk Box Europe.”
As we saw this week, all this ‘hope for peace’ stuff and its impact on share prices will be critically important for stocks for some time. When peace talks seemed positive, Reuters reported, “that stocks were lifted by signs of progress in peace talks between Russia and Ukraine.” But in the same breath, it referred to “a widely tracked part of the Treasury yield curve, which flashed warning signs for the US economy as it neared inversion”. By the way, on more professional assessments of the yield curve, it’s actually not predicting a recession is near. In fact, even when the curve is negative, it can take more than a year for a recession to show up.
I’d forget about recession possibilities until maybe late 2023 or early 2024. (Michael Knox of Morgans looked at the so-called curve ball threat of a negative yield curve and hit it for a six in Monday’s TV show [1].)
Locally our market was helped by the Budget as CommSec’s Craig James explained: “Big government spending, still-low interest rates and solid economic growth are all supportive of Aussie shares.” And it’s why I wrote that piece a few weeks back headlined: ‘Buy before May and stay!’
For the quarter, our S&P/ASX 200 Index was just in positive territory, but the Yanks were in negative territory, down about 5%, as this chart shows.
S&P 500 Q1
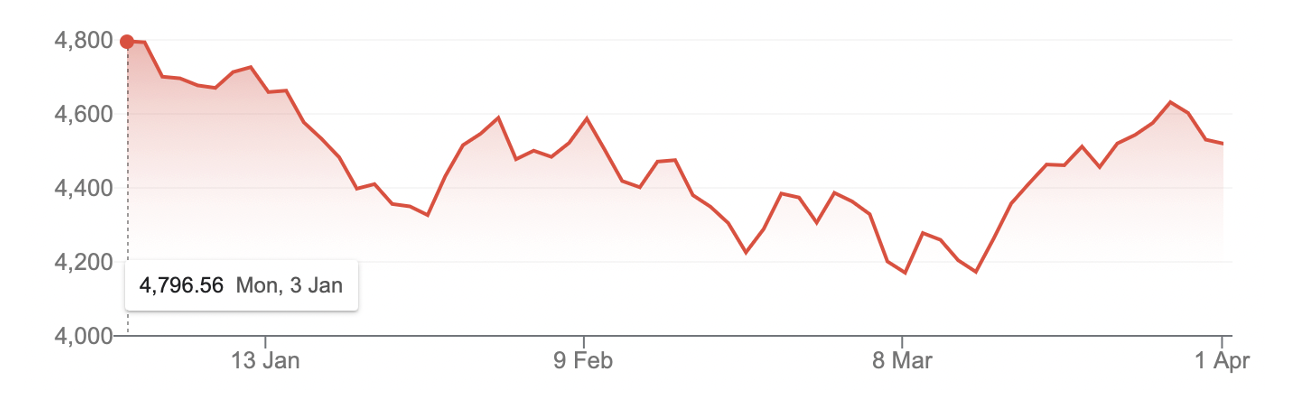
Our Index’s heavy reliance on resources, financial and energy stocks and lesser dependence on tech stocks has helped our market outperform US markets. This is one reason why I think a 10% gain for our market this year is not a big call.
AMP’s Shane Oliver is a little more conservative on what stocks can do but he is positive about our future. You can see his take on the Budget and stocks here. [2]
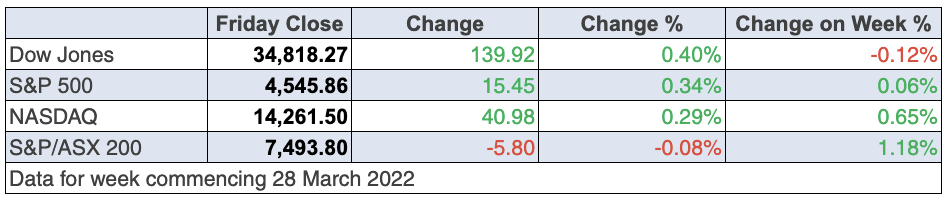
To the local story and the S&P/ASX 200 rose 87.6 points (or 1.2%) for the week to finish at 7493.8 and that’s the third weekly gain on a trot.
Here are the big winners and losers for the week, with resources having a pretty positive week.
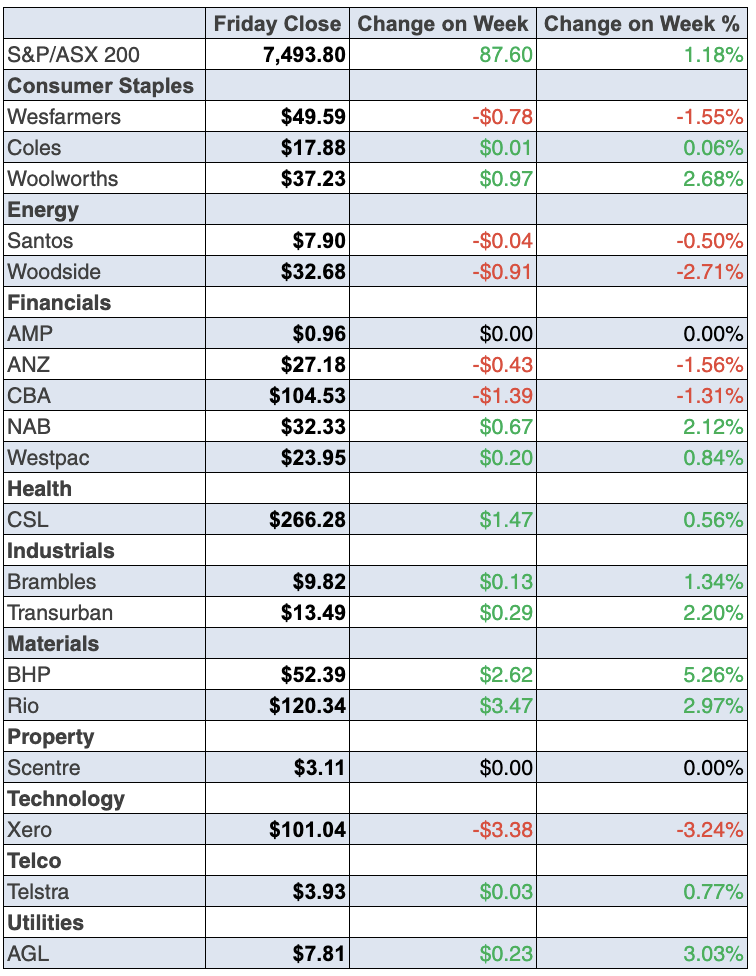
BHP had a good week up 4.34% to $52.39, while Fortescue rose 7.5% to $21.06. Meanwhile, the lithium plays remained popular with Mineral Resources a star as the chart below shows and Allkem joining the investor lithium party, after upgrades to future pricing excited the market.
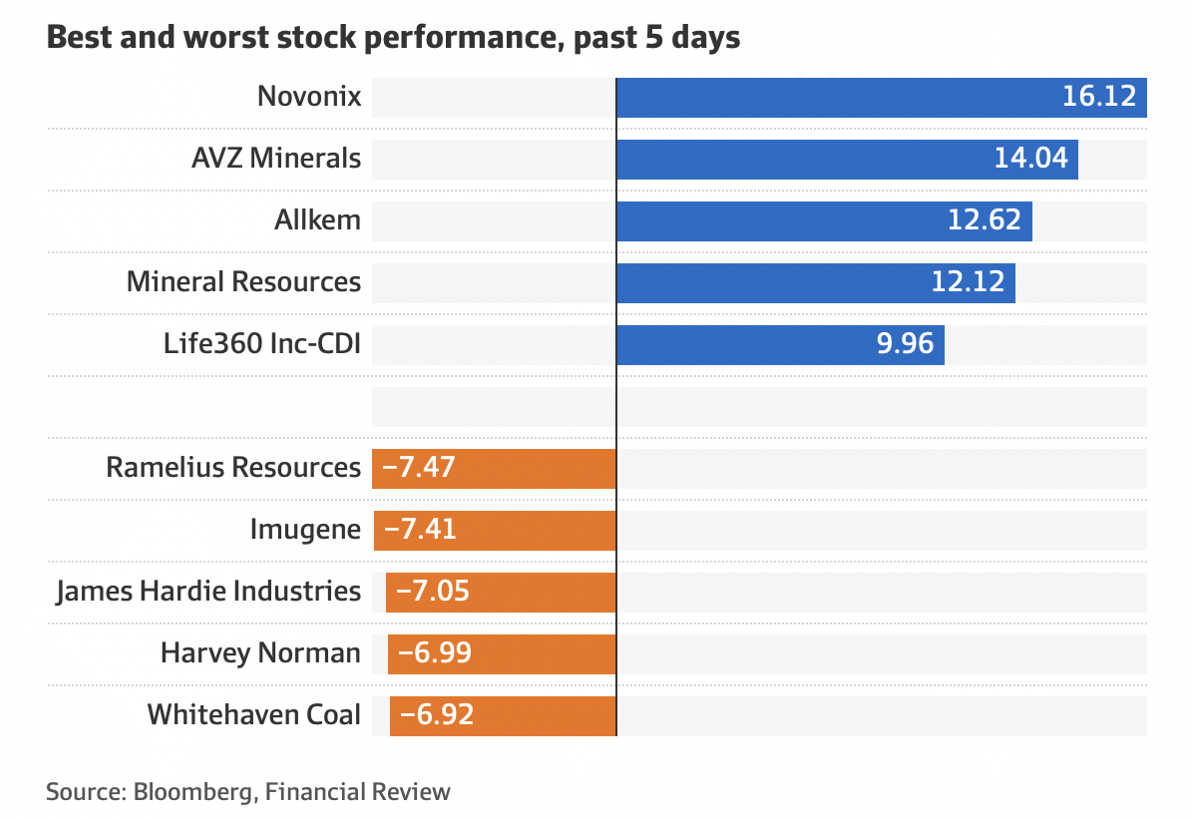
And even though tech stocks rose and then peeled back later in the week, I think we saw a sneak preview of what will eventually happen later this year or early next, with these out-of-favour share plays. As the AFR put it: “Novonix soared 16.1 per cent to $6.41, Life360 advanced 10 per cent to $5.74, Megaport climbed 6.3 per cent to $13.82 and NEXTDC firmed 6.8 per cent to $11.81.”
If you’re wondering why energy stocks fell this week with Woodside down 2.74% to $32.68 and Santos off 0.75%, blame peace talks and the US’s largest release of oil from its strategic reserves as an anti-Russian move.
And I suspect we saw a sneak preview of what might happen to Magellan’s shares if it can give the market some good news this month when it updates its performance. The stock was up 7.87% after dipping under $14 on Monday. It finished at $15.35.
What I liked
- The Budget cut the fuel excise by 50% for six months and the stimulus of the Budget for this year, though next year (whoever is Treasurer) will be time for a tough Budget.
- Job vacancies rose by 6.9% (or 27,300) to a record 423,500 available positions in the three months to February. Vacancies are up 46.6% or 134,700 available positions in February compared with a year ago. The level of job vacancies in February was 86% (or 195,800 positions) higher than in February 2020, prior to the start of the pandemic.
- Private sector credit rose by 0.6% in February to be up 7.9% on a year ago – the strongest annual growth rate in 13 years.
- Dwelling approvals rose by a record 43.5% in February to 18,675 units.
- Oil producers’ stocks fell in response to a 7% slide in the oil price. Lower oil prices will be good for economic growth and stock prices.
- Dwelling prices grew 0.7% in March as momentum in the smaller capital cities and regional areas outweighed falls in Sydney and Melbourne. The boom has moderated as affordability pressures rise, supply lifts and fixed rates increase. In annual terms, growth slowed to 18.2%.
- The AiGroup Australian Performance of Manufacturing Index (PMI) for manufacturing rose by 2.5 points to 55.7 in March. And the final IHS Markit Australia Manufacturing PMI lifted from 57 to 57.7 in March. Readings over 50 denote an expansion in activity.
- Total household wealth (net worth) rose by $627.6 billion (or 4.5%) in the December quarter to a record-high $14,676.7 billion or $14.7 trillion. Wealth is up 20.2% on a year ago.
- The US inflation measure (a core personal consumption deflator) lifted 0.4% in February to be up 5.4% on the year (survey: 5.5%). Any inflation number lower than expectations is worth liking.
- US consumer confidence rose from 105.7 to 107.2 in March (survey: 107). The S&P Case-Shiller home price series rose 1.4% to be up 19.1% over the year (survey: 18.4%).
- In March, 431,000 jobs were added, leaving the total number of jobs 1.6 million shy of pre-pandemic levels.
- In its third estimate of fourth-quarter GDP growth, US gross domestic product increased at a 6.9% annualized rate, the Commerce Department said. That was revised slightly down from the 7% pace estimated in February but was still a good number.
What I didn’t like
- Housing finance approvals, excluding refinancing, fell in February for the first time since October. Approvals sank 3.7% in the month, from a record high in January.
- Business construction loans plunged by 40.2% in February to be down 9.4% on a year ago. That needs to be watched.
- Reuters reported that Sweden’s H&M fell by 12.9% “after saying it would need to raise prices this year and reported weak quarterly profit amid high raw material and transportation costs.”
A big like
Last week what I didn’t like easily outnumbered what I liked. But this week the likes trump the dislikes big time! I’m glad dislikes trumping likes hasn’t become a trend. One day it will be and that’s when “positive Pete” (as 2GB’s Ben Fordham and Alan Jones call me) will turn negative and I’ll tell you to go defensive. And that’s a promise!
The week in review:
- This week in the Switzer Report, I look at two questions investors are asking are: can we trust this bounceback of stocks? And is the worst behind us? These answers are necessary if you want to go long stocks, run and sell, or even do nothing and go with the flow. Here is my view. [3]
- Paul (Rickard) says there’s no doubt Magellan is super cheap on all the metrics, including a fantastic dividend yield. But has the stock bottomed? For Paul, Magellan is a relatively simple proposition. Read what he has to say in his article today. [4] And following the release of the Federal Budget this week, Paul assesses how it will affect Australians and their super. In the fine print, he’s found 5 important changes to your [5]super that will come into effect on 1 July.
- James Dunn says lithium is really on a tear, with the “white gold” in huge demand on the back of booming demand for electric vehicle (EV) batteries and renewable energy applications. While it’s currently in a supply deficit, Australia is well-served for lithium producers and there’s a swathe of projects being quickly advanced. Here are 4 stocks James likes and 6 of what he considers are the best hopefuls. [6]
- Tony Featherstone says high inflation data is inevitably followed by stories about companies with “pricing power” and the goal is to own companies that can lift prices to maintain their profit margin as costs rise, without denting demand for their product. But Tony says you should consider the reverse: companies with low pricing power because high inflation can sometimes help rather than hinder lower-quality firms. For investors who prefer to own ASX-listed companies with higher pricing power, Tony looks at 7 ideas for you to consider. [7]
- In our “HOT” stock column this week, Raymond Chan, Head of Retail at Morgans, gives his reasons for [8]why he thinks JB Hi-Fi (JBH) should be added to an investor’s portfolio, Michael Gable, Managing Director of Fairmont Equities [9], explains why [10] he thinks Xero (XRO) is a buy.
- In Buy, Hold, Sell — What the Brokers Say, BHP Group received an upgrade while ResMed and Seek found themselves in the not-so-good books [11] in the first edition, while the second edition was all about commodities stocks, [12] with Fortescue Metals and Rio Tinto receiving upgrades, and Newcrest Mining and Woodside Petroleum getting downgrades.
- And finally, in Questions of the Week, [13] Paul Rickard answers subscribers’ queries about whether Star Entertainment will be like Crown and prove to be good buying? Does a share buyback lead to a higher dividend yield? Will I pay capital gains tax if I accept Hochtief’s offer for Cimic? Should I take my medicine and cut my losses on Nuix?
Our videos of the week:
- Discussing the positives of medical cannabis | The Check Up [14]
- Paul Rickard: Is Magellan a buy + Michael Knox: Will the Aussie dollar keep on rising? | Switzer Investing [15]
- Federal Budget 2022: Winners everywhere! But what about investors? [16]
- Boom! Doom! Zoom! | 31 March 2022 [17]
- Tech stocks to buy? Zip, EML, ELO & more. Does the Budget help stocks for 2022? + House prices down? | Switzer Investing [2]
Top Stocks – how they fared:
The Week Ahead:
Australia
Monday April 4 – Retail trade (Detailed, Feb)
Monday April 4 – ANZ job advertisements (March)
Monday April 4 – Melbourne Institute inflation gauge (March)
Tuesday April 5 – Weekly consumer confidence (April 3)
Tuesday April 5 – New vehicle sales (March)
Tuesday April 5 – Reserve Bank Board policy meeting
Thursday April 7 – Payroll jobs and wages (March 12)
Thursday April 7 – International trade (Feb)
Friday April 8 – Reserve Bank Financial Stability Review
Friday April 8 – Business turnover (Feb)
Overseas
Monday April 4 – US Factory orders (Feb)
Tuesday April 5 – US ISM services index (March)
Tuesday April 5 – US S&P Global services index (Final, March)
Tuesday April 5 – US Balance of trade (Feb)
Wednesday April 6 – China Caixin services gauge (March)
Wednesday April 6 – US Federal Reserve meeting minutes
Thursday April 7 – US Consumer credit change (Feb)
Friday April 8 – US Wholesale inventories (Feb)
Saturday April 9 – China Vehicle sales (March)
Food for thought: “Success is a lousy teacher. It seduces smart people into thinking they can’t lose.” — Bill Gates
Stocks shorted:
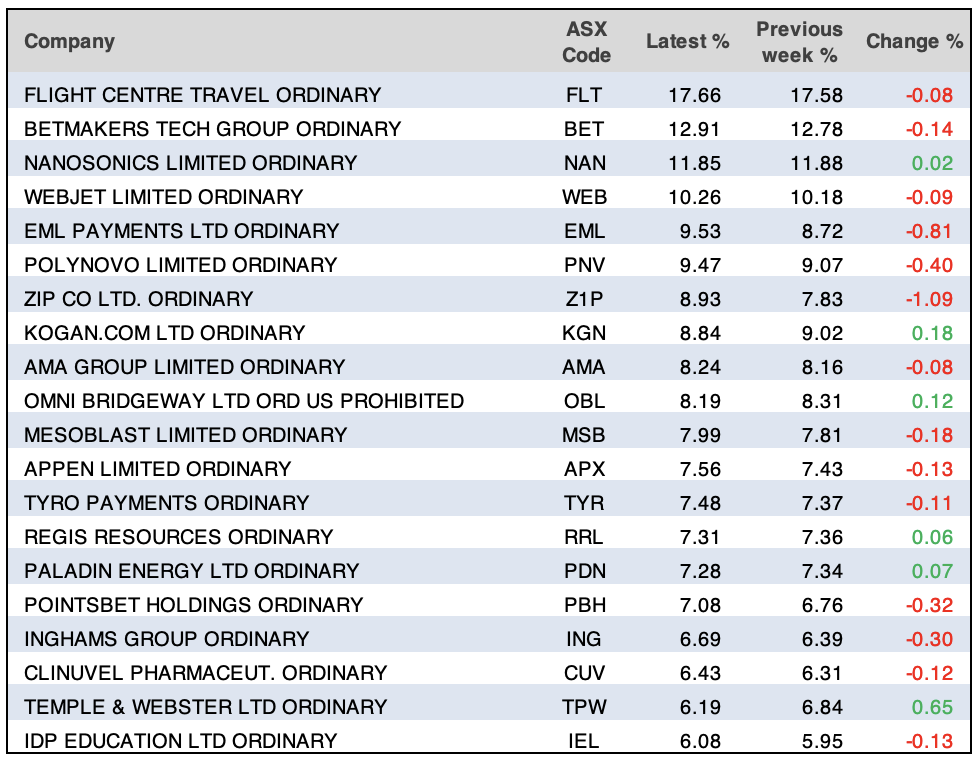
ASIC releases data daily on the major short positions in the market. These are the stocks with the highest proportion of their ordinary shares that have been sold short, which could suggest investors are expecting the price to come down. The table shows how this has changed compared to the week before.
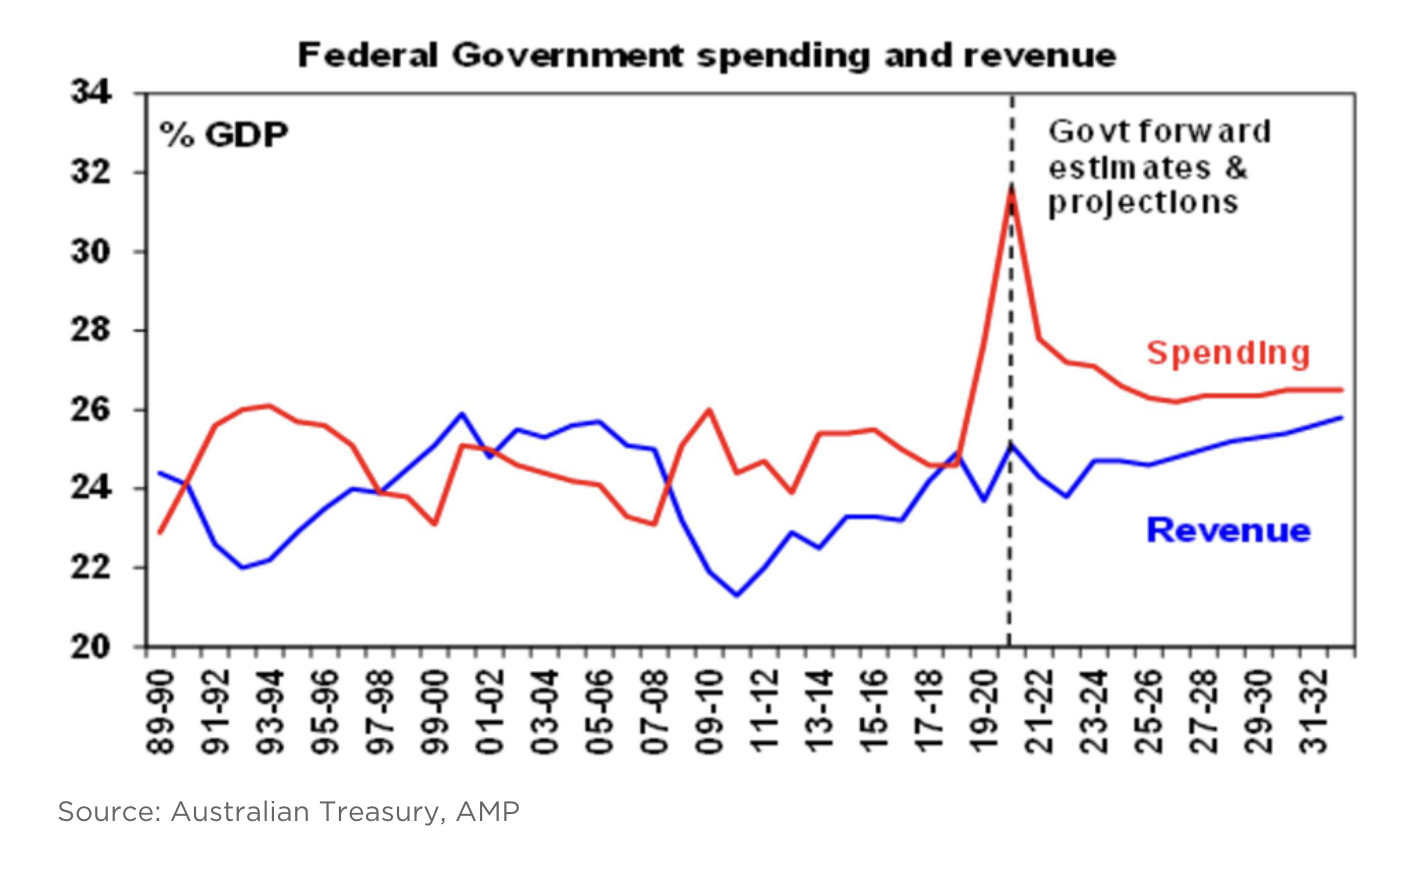
Chart of the week:
Our chart of the week forms as part of a wider assessment of the Federal Budget from AMP Capital, with Chief Economist Shane Oliver predicting that government spending is set to rapidly decline from the unprecedented stimulus measures over the last two years and come more in line with its revenue as it steadily increases.
“Out to 2025 the deficit is projected to fall rapidly as covid programs phase down. However, spending is still expected to settle about a high 26.4% of GDP. This is well above the pre-covid average of 24.8% and reflects higher health/NDIS and defence spending. Rising revenue with a growing economy is assumed to do all the deficit reduction heavy lifting from 2026,” Oliver says.
Top 5 most clicked:
- Can we trust this bounceback? Is the worst behind us? [3] – Peter Switzer
- 7 stocks to consider as inflation bites into profit margins [18] – Tony Featherstone
- 5 super changes for the new year [19] – Paul Rickard
- 4 lithium producers + 6 hopefuls [20] – James Dunn
- Is Magellan (MFG) a buy now? [21] – Paul Rickard
Important: This content has been prepared without taking account of the objectives, financial situation or needs of any particular individual. It does not constitute formal advice. Consider the appropriateness of the information in regards to your circumstances.