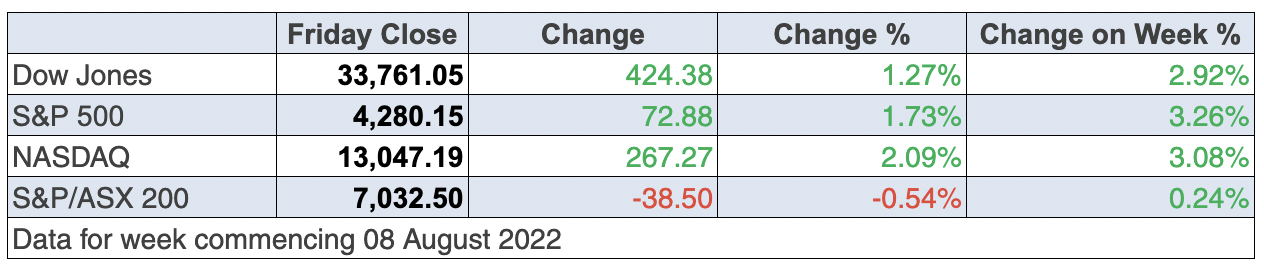
As predicted, the August 10 Consumer Price Index (CPI) number in the US was going to be critically important for stocks. Our market liked it but we only went up 0.25% for the week. But the Yanks loved it, putting on over 2% for the week.
If we look at the overall market rise of the S&P500 since the 8.5% inflation number came out on Wednesday, the gain has been over 3%. At the same time, our market only put on 16.9 lousy points!
That’s a little strange but the important point is that the US market is now saying inflation has peaked, which puts less pressure on the Fed to raise rates as rapidly and as high as once was predicted by the excessively negative experts, whose expertise always needs to be queried.
All three US indexes were up overnight, with the Nasdaq rising over 2%, showing the Yanks believe in a tech recovery more than we Aussies do at the moment. For the US, the four weeks of gains have been the longest winning streak since November 2021.
The big watch now will be whether the downtrend in inflation continues so the next CPI on September 13 will be a really important one. A bigger drop than expected would be a ripper for stocks, but let’s get objective about what we saw this week on the US inflation front.
This is what Tom Essaye of The Sevens Report concluded: “Over the past two trading days, investors have used the underwhelming CPI and PPI as cues to begin to price in a greater chance of an economic ‘soft landing’ and a reduced chance of a material economic slowdown, based on the idea that the Fed won’t have to hike rates as much as previously feared now that inflation has likely peaked.” I liked what he then added: “We can see evidence of this across assets.”
When I saw the headline number for US inflation come in at 8.5% when 8.8% was expected, I was cautiously positive, but once I looked at what has happened to gasoline prices, rents, power costs, etc. they were suggesting that prices were trending down in many areas of the economy. That’s a good omen for their August CPI which we see in September.
If that comes in again better than expected, then my prediction of a few months ago that this could be a year that the old “sell in May and go away, come back on St. Leger’s Day” works.
St. Leger’s Day is mid-September, so that CPI release date looks really important for stocks.
One interesting development this week that went under many of our radars was the passing of the Inflation Reduction Act by the US Senate. This US$430 billion package was designed to address inflation in two key ways: by lowering energy and health care costs for families and by helping to bring down the deficit.
Interestingly, it looks to have a lot of support but crucially it has to help lower inflation.
“And that’s why even Democrats and Republicans, former Treasury secretaries, economists across the board have said that this bill will make a positive impact on inflation, while also tackling some of the biggest and long-standing issues facing our country, like prescription drugs and tackling climate change,” said Brian Deese, director of the National Economic Council, in an interview [1] this week with US-based National Public Radio’s Morning Edition.
One final note on what I learnt from US trading this week was the great reporting performance of Walt Disney Co., which spiked over 12% this week. Part of the gain was this news: “Walt Disney edged past Netflix [2] with a total of 221 million streaming subscribers at the end of the most recent quarter and announced it will launch a Disney+ option with advertising this December.” (The Guardian)
But I liked an interesting takeout from CEO Bob Chapek: “We had an excellent quarter, with our world-class creative and business teams powering outstanding performance at our domestic theme parks, big increases in live-sports viewership, and significant subscriber growth at our streaming services”.
OK, we can see its streaming business is doing well but so are its theme parks and other Disney businesses that rely on people getting out of their homes and doing normal stuff like shopping. These are the real-life happenings of what we economists have been talking about when we referred to the reopening of the economy.
The arrival of Omicron and the recent strains of Covid that have delayed China’s reopening and made consumers everywhere wary of doing things as normal has delayed the comeback of business profits and the growth of economies. That said, this Disney report, which surprised the market, could be a sign of things to come for other businesses.
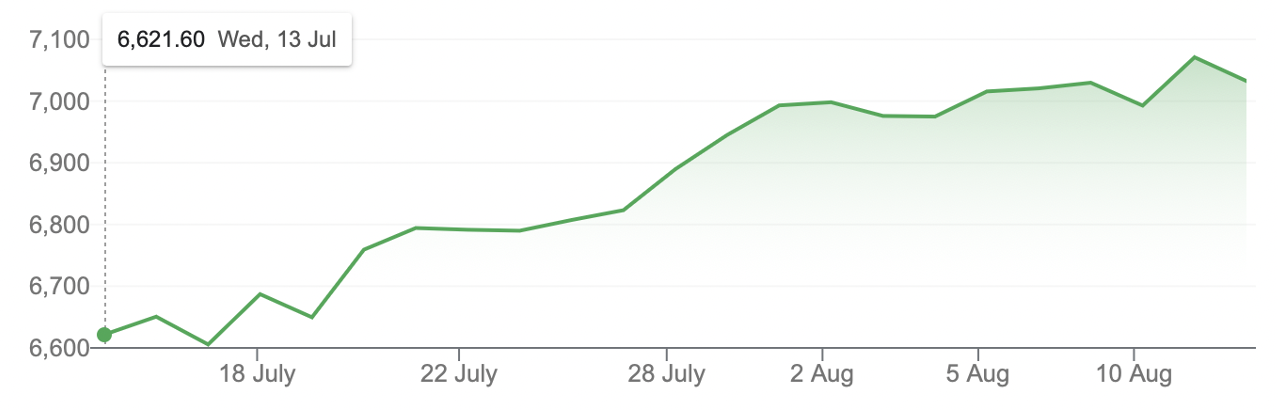
To the local story and we were up for the fourth week in a row, but Friday’s 0.5% drop explained why the weekly gain was only 0.24% (or 16.9 points) to leave the S&P/ASX 200 Index at 7032.5. But if you need to be positively inspired, the monthly chart looks great.
S&P/ASX 200 (one month)
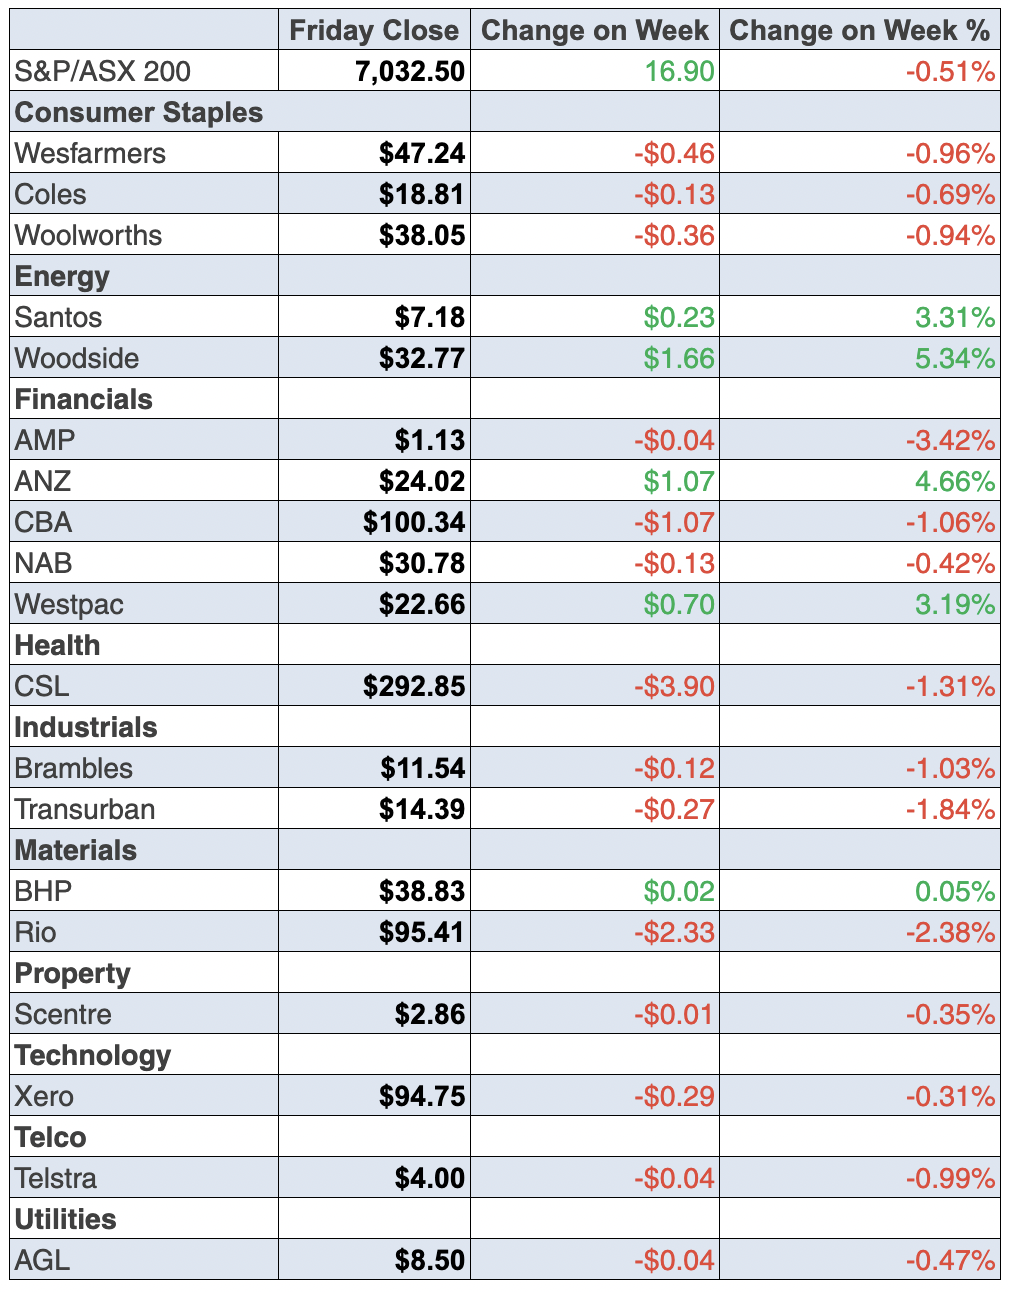
Big news on Friday was the jump in Woodside’s share price by 3.7% to $32.77, while IAG’s $347 million profit helped its share price rise 1.1% to $4.66.
To the banks, and despite reporting pretty well, the CBA was down 0.73% for the week to $100.34, NAB was up 0.13% to $30.78, Westpac gained 3.28% to $22.66 but ANZ took the cake, up 5.77% to $24.02.
Nice performer after a good report was REA, which we have focused on in recent weeks on the TV show, Switzer Investing on YouTube, on Monday and Thursday. Over the week, the share price has risen 7.9% to $133.85. For the month, it’s up 12.9% and since June 17 the gain has been a big 40%! And that’s despite rising interest rates and reports of 20% plus house price falls!
Telstra surprised us with a rise in its dividend — it lifted its final dividend by half a cent to 8.5 cents, bringing its full-year dividend to 16.5 cents per share. But that didn’t help the stock rise this week, with a 0.25% fall to $4.
Meanwhile, for the big miners, Fortescue had the best week, up 2.43% to $18.94, while BHP was basically flat at $38.33. However, Rio copped it, down 3.05% but it was simply because it went ex-dividend.
In case you don’t know what’s up next week for reporting, here are some of the big names doing a show-and-tell: JB Hi-Fi, Bluescope, BHP, Seek, Challenger, Santos, Magellan, Domain, Medibank, Transurban and many more. It’s going to be a great week for stock market tragics.
What I liked
- The CBA reported that 78% of home loan borrowers were ahead on their repayments by an average of 36 months.
- The National Australia Bank (NAB) business confidence index rose from a 6-month low of 1.5 points in June to 6.9 points in July (long-run average: 5.4 points). And the business conditions index rose from 14.4 points in June to a 13-month high of 20.3 in July (long-run average: 6 points).
- A simple average of nominal business turnover indexes calculated by CommSec shows the All Industry index increased by 20.8% over the past year, the fastest growth in 13 months.
- The US Consumer Price Index (CPI) was flat in July (survey: 0.2%) but was up 8.5% over the year (survey: 8.7%). The core CPI (ex-food and energy) lifted 0.3% in July (survey: 0.5%) to be up 5.9% over the year (survey: 6.1%). The fall from 9.1% in the June number is a good sign.
- The household spending indicator from the Australian Bureau of Statistics (ABS) rose by 10.2% over the year to June. Household spending increased the most on transport (up 22.7%), followed by hotels, cafes and restaurants (up 17.1%). These numbers should slow down as interest rate rises start to bite.
- US consumer inflation expectations fell from 6.8% to 6.2% in July (survey: 6.7%).
- The NFIB business optimism index in the US rose from 89.5 to 89.9 in July (survey: 88).
- The producer price index (PPI) fell by 0.5% in July but was up by 9.8% on the year (survey: 10.4%). It was a big number but less than expected and is falling for the first time in more than two years as energy costs declined.
What I didn’t like
- From the NAB business survey, all price and cost measures were at record highs in July together with capacity utilisation.
- The monthly Westpac-Melbourne Institute consumer sentiment index fell 3% in August (a ninth consecutive monthly decline) to a two-year low of 81.2 points. Sentiment is down 22% on a year ago. Confidence in regional or rural areas fell by 5 in August to a record low of 72.8 points (lowest since January 1996). The RBA shouldn’t ignore these consumer optimism figures, which are becoming very pessimistic.
- The weekly ANZ-Roy Morgan consumer confidence index fell by 4.5% last week to 80.3 points, the lowest level since April 2020. The long-run index average since 1990 is 112.2 points.
- Unit labour costs in the US rose 10.8% over the year to the June quarter (survey: 9.5%) with non-farm productivity down 4.6% (survey – 4.7%).
Note to Reserve Bank Guv, Dr Phil Lowe
The latest data drop on the confidence level for our buddies in the bush has to be noted before the central bank’s next interest rate rise. This is what CommSec economist Ryan Felsman had to say: “Worryingly, rural or regional Australia consumer confidence fell by 5.0 per cent in August to a record low of 72.8 points (the lowest level since January 1996). Sentiment has dropped by 27.2 per cent since March due to flooding on Australia’s East Coast and increased worries about the threat of imported foot-and-mouth disease to Australia’s beef industry. Bloomberg estimates that a potential outbreak of the disease could ravage Australia’s $32 billion livestock industry, with a potential estimated direct economic impact of around $80 billion.”
And our country cousins are also coping with interest rates rising as inflation drives up the cost of living.
The week in review:
- This week in the Switzer Report was all about the US inflation reading for me. My time-weary memories of Woodstock, not the actual event but the movie that followed, came back to me when I thought about the big market event last Thursday. If it’s bad, stocks will fall, and vice versa. [3] Guess that one aged well!
- Paul (Rickard) believes there is value in Aurizon (AZJ) [4] given the market’s reaction to its expected profit result today. Later in the week, Paul looked at how CBA has delivered the best total return over 3 years, 5 years and 10 years. He assesses the bank’s performance and gives his view on whether it’s a buy, hold or sell. [5]
- Tony Featherstone says cloud computing is one of the great technology megatrends of our time and explains why investors seeking exposure to a recovery in tech stocks should focus on the most powerful structural trends within the sector. In his article this week, Tony examines 1 stock and 1 ETF he likes. [6]
- James Dunn heads to small-cap land for a look at three potential buys under 75 cents. [7]He thinks these are great representatives of the type of interesting stories to be found at these market-capitalisation levels – for investors who appreciate both the potential, but also the risks.
- In our “HOT” stock column Raymond Chan, Head of Asian Desk at Morgans, tells us why Australian fashion jewellery retailer Lovisa Holdings Ltd (LOV) is worth watching. [8] Then Michael Gable, Managing Director of Fairmont Equities [9], says Rio Tinto (RIO) looks like a buying opportunity. [10]
- In Buy, Hold, Sell — there were 4 upgrades and 13 [11]downgrades in the first edition and 4 upgrades and 12 downgrades [12] in the second edition.
- And finally, in Questions of the Week, [13] Paul (Rickard) answers your queries about whether industrial property trusts are good value, and how you assess that; What is an ETF that invests in global healthcare?; The Hang Seng is in a slump – is it time to invest in a China ETF? CBA’s final dividend is a fully franked $2.10 per share – what’s the last day to buy the shares to get this dividend?
Our videos of the week:
- Why it’s important to have a healthy immune system | The Check Up [14]
- Is the stock market poised to boom or slump? + We rate these stocks: REA, AD8, BHP & more! | Switzer Investing (Monday) [15]
- A great stocks game changer! + What would lower US inflation mean for Aussie interest rates? | Mad about Money [16]
- Is it buy time for stocks with US inflation better than expected? + Stocks in focus: BHP, REA, XRO! | Switzer Investing (Thursday) [17]
- Boom! Doom! Zoom! | 11 August 2022 [18]
Top Stocks – how they fared:
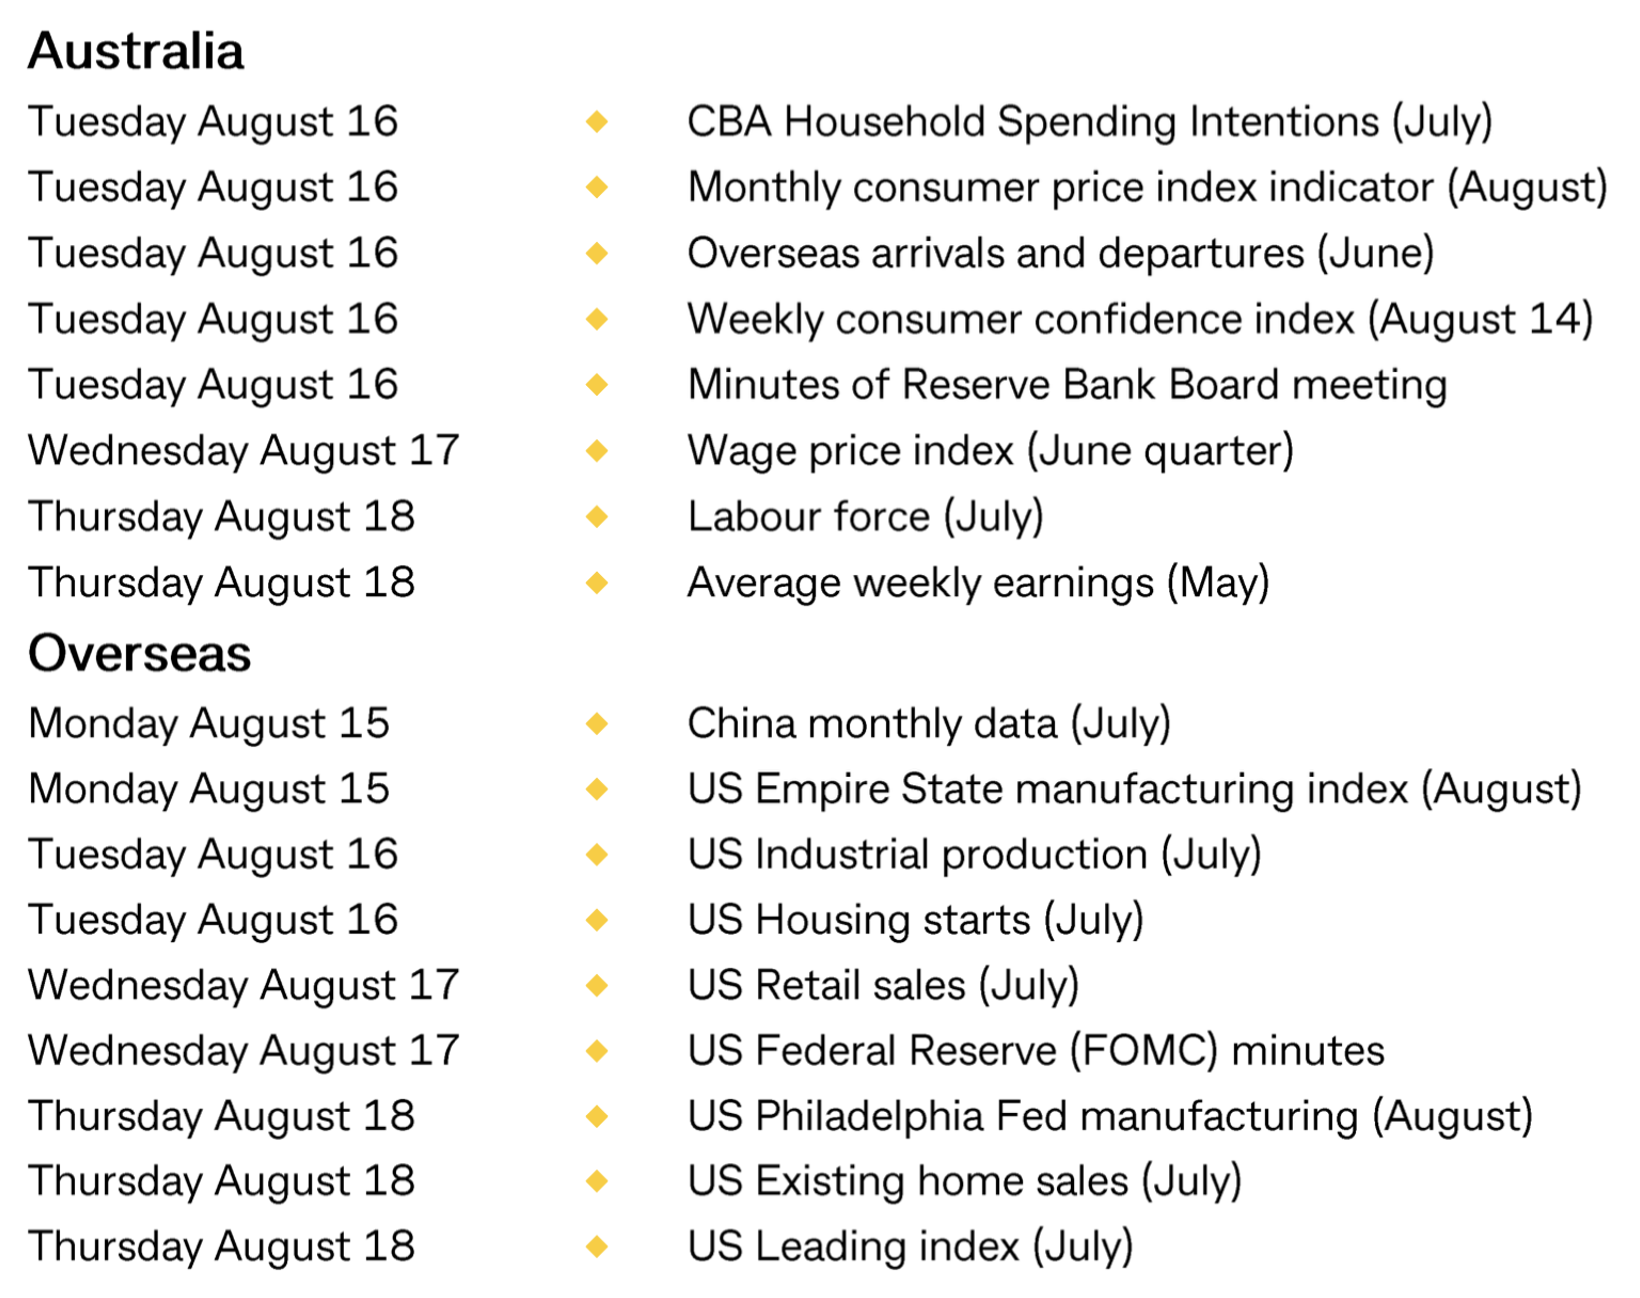
The Week Ahead:
Food for thought: “If not to make the world better, what is money for?” – Elizabeth Taylor
Stocks shorted:
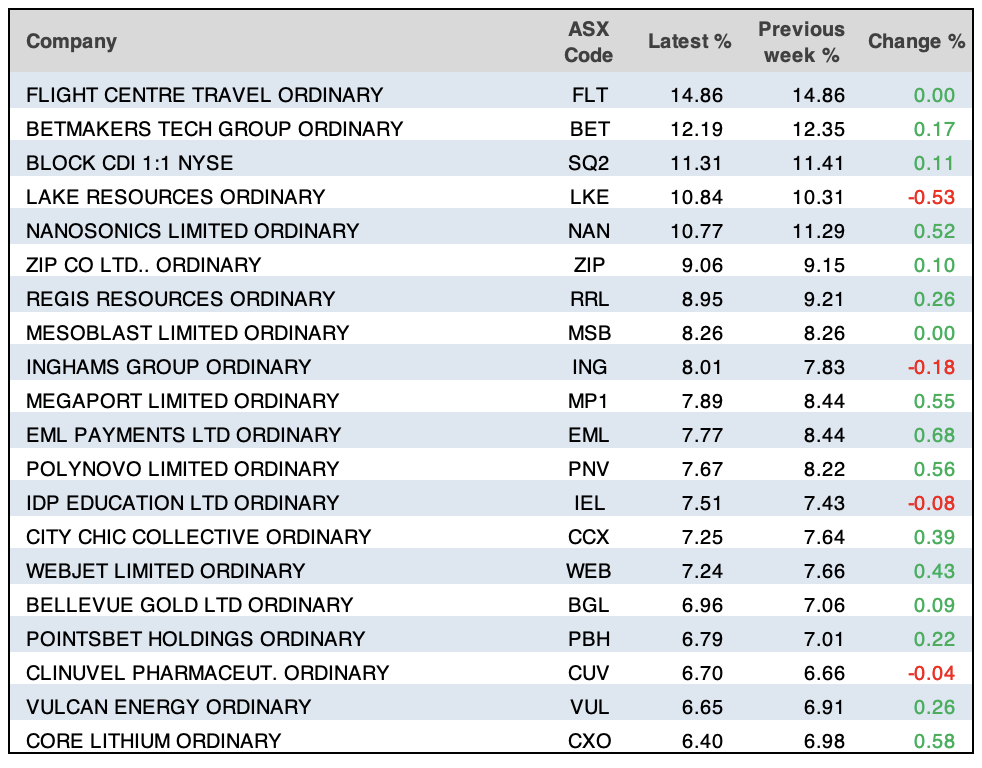
ASIC releases data daily on the major short positions in the market. These are the stocks with the highest proportion of their ordinary shares that have been sold short, which could suggest investors are expecting the price to come down. The table shows how this has changed compared to the week before.
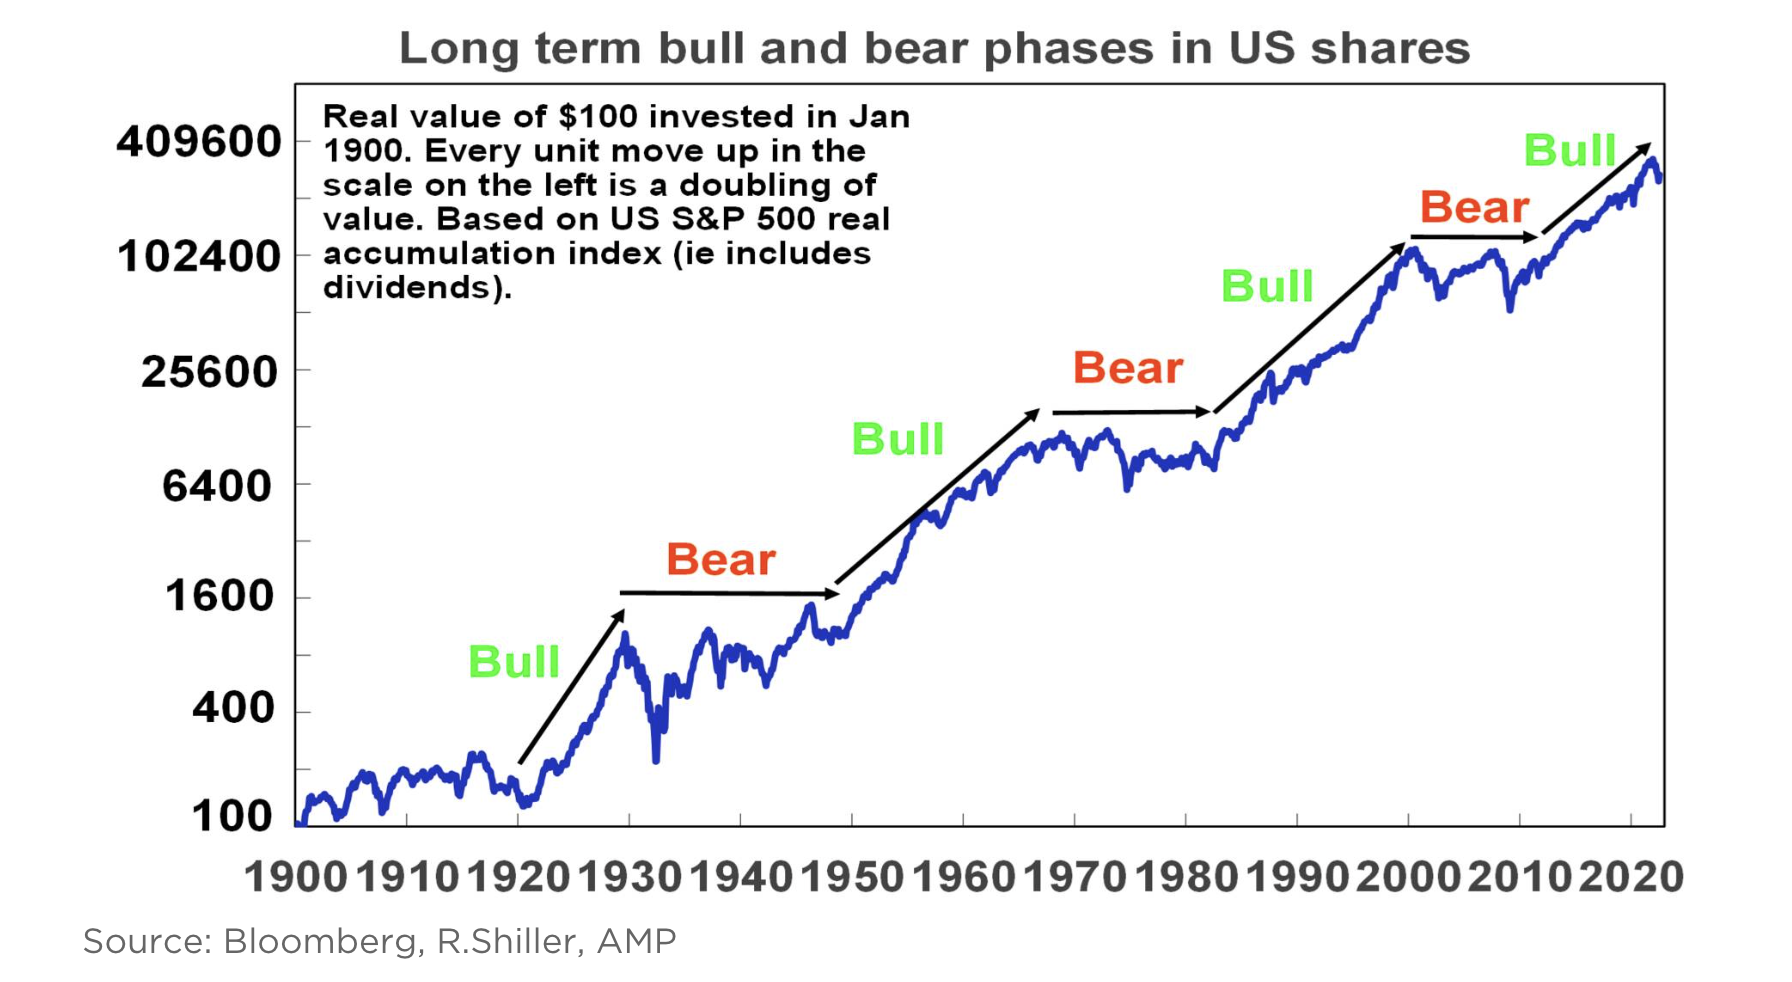
Chart of the week:
In our chart of the week, it pays to remember that while we may have reason to get excited about a potential uptrend in the market, it is inherently cyclical.
“The long term or secular cycle – share markets go through long term or secular bull and bear phases, often lasting between 10 to 20 years. This is [most clear] in the US share market and illustrated by the following chart. It shows the cumulative real value of $100 invested in 1900. Secular bull markets – or 10–20-year periods where the trend in shares is up – can be seen in the 1920s, 1950s and 60s, the 1980s and 90s and arguably over the past decade. In between the 1930s and 1940s, 1970s and 2000s are secular bear markets – which are long periods where shares have poor and volatile returns,” says Shane Oliver of AMP Capital.
Top 5 most clicked:
- Hold your breath & nerve until August 10 [19] – Peter Switzer
- Three under 75 cents [20] – James Dunn
- Aurizon delivers as expected – market reaction creates value [21] – Paul Rickard
- Buy, Hold, Sell – What the Brokers Say [22] – Rudi Filapek-Vandyck
- 1 stock and 1 ETF I like to play the powerful cloud-computing megatrend [23] – Tony Featherstone
Important: This content has been prepared without taking account of the objectives, financial situation or needs of any particular individual. It does not constitute formal advice. Consider the appropriateness of the information in regards to your circumstances.