Despite a late recovery, the Australian share market finished marginally in the red for March. Down 1.1% in price terms (0.2% if dividends are included), the Aussie market lost ground relative to the US market. The S&P 500 rose by 3.5%, while the NASDAQ added 6.7%.
Our model portfolios held firm, with the growth portfolio continuing to outperform the benchmark index. The income portfolio, with its overweight position in financial stocks, gave back some earlier gains. Both are showing solid returns for the year.
There are two model portfolios – an income-oriented portfolio and a growth portfolio.
The objectives, methodology, construction rules and underlying economic assumptions can be referenced here: (see: https://switzerreport.com.au/our-portfolios-for-2023/ [1]
These are long-only model portfolios, and as such, they are assumed to be fully invested at all times. They are not “actively managed”, although adjustments are made from time to time.
In this article, we look at how they have performed so far in 2023. To do so, we will start by examining how the overall market has fared.
Consumer stocks lead the market
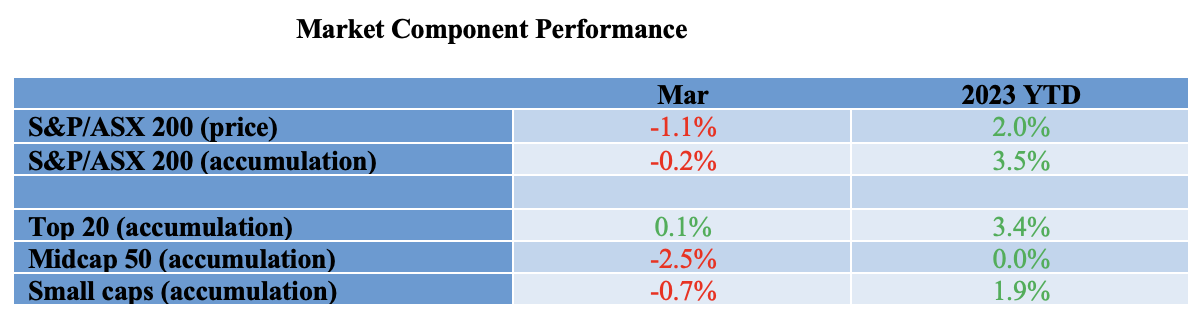
The tables below show the performances in March and for the calendar year for the components and industry sector that make up the Australian market. Overall, the market (as measured by the benchmark S&P/ASX 200) is up by 2.0% and when dividends are included, by 3.5%. In March, the market lost 0.2%.
The large caps are doing better than the small caps. The top 20 stocks (which includes the 4 major banks, Macquarie, Woolworths and major miners in BHP, Rio and Fortescue) are up 3.4% for the year. The top 50 stocks are doing even better. Small caps, which measures the performance of stocks ranked 101st to 300th by market capitalization, lost 0.7% in March. For the year, it is marginally behind the overall market with a return of 1.9%.
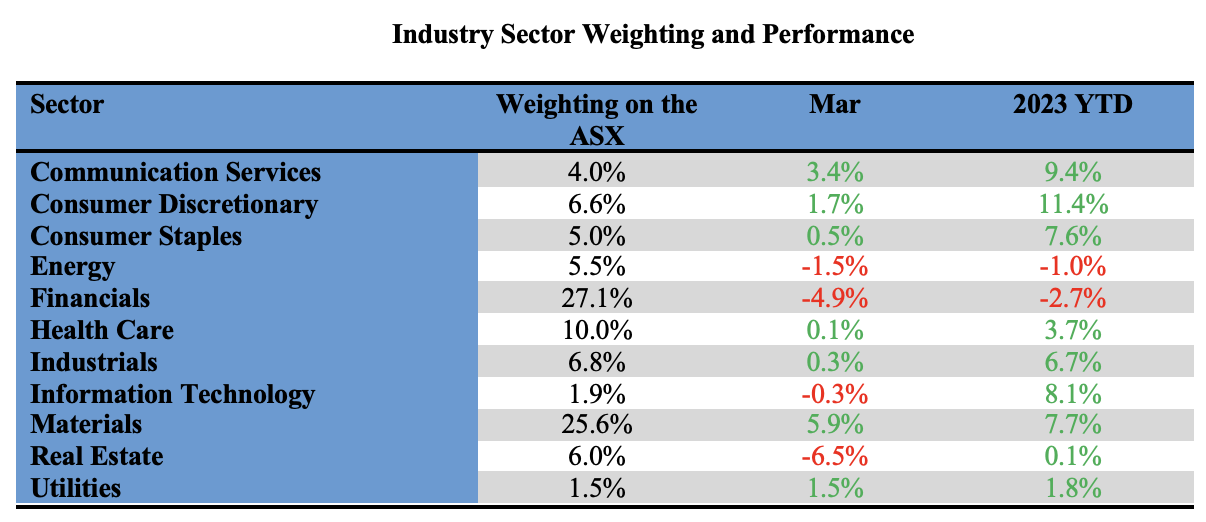
With the industry sectors, the consumer sectors are leading the way. This is somewhat surprising, given the concern in the market about consumer sentiment – perhaps the market was too bearish. Consumer discretionary is up 11.4% in 2023, Consumer Staples by 7.4% and Communication Services by 9.4%.
The largest sector on the ASX, financials, which makes up 27.1% by weighting, lost 4.9% in March and is down 2.7% in 2023. The second largest, materials, rose by 5.9% in March and is up 7.7% for the year.
Another standout in March was the performance of real estate, which lost 6%. Year to date, the sector is largely flat with a return of 0.1%.
Portfolio performance in 2023
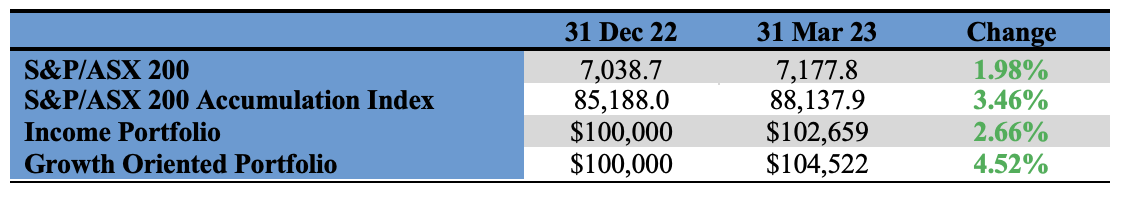
The income portfolio to 31 March has returned 2.66% and the growth-oriented portfolio has returned 4.52% (see tables at the end). Compared to the benchmark S&P/ASX 200 Accumulation Index (which adds back income from dividends), the income portfolio has underperformed by 0.80% and the growth portfolio has outperformed by 1.06%.
Income portfolio
The objective of the income portfolio is to deliver tax advantaged income whilst broadly tracking the S&P/ASX 200.
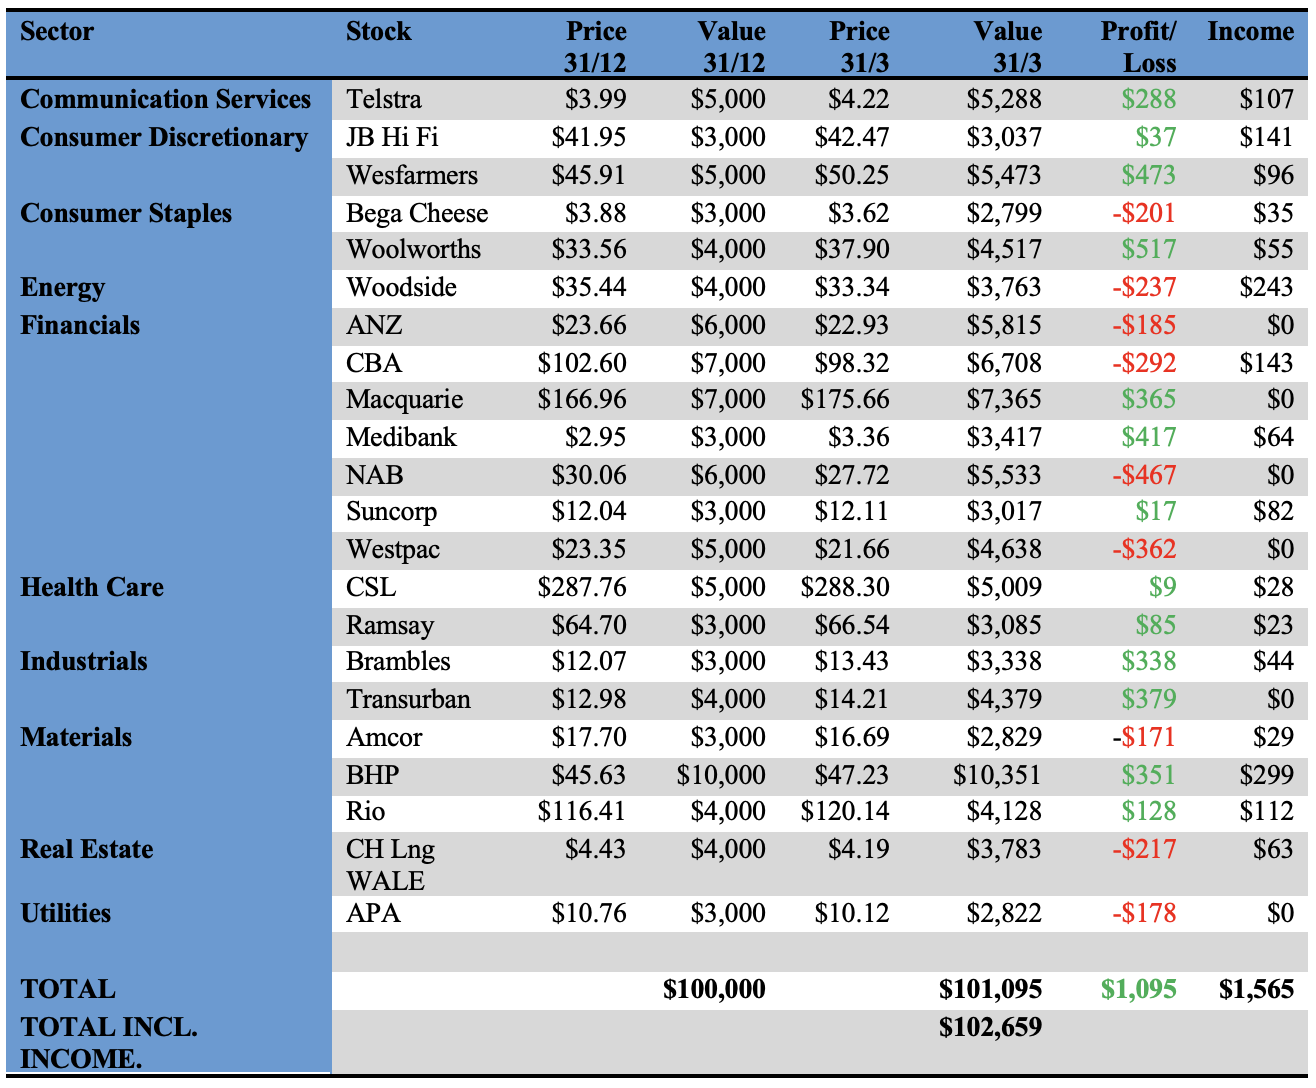
The income portfolio is forecast to deliver an income return of 5.0% (based on its opening value at the start of the year), franked to 80.3%. With declared during the February reporting season marginally better than forecast, it is on track to meet this. Year to date, the income return is 1.57% franked to 90.5%.
In the month of March, the income portfolio returned -0.65%. This underperformed the benchmark index by approximately 0.49%. For the year, it has returned 2.66%, which is 0.80% behind the index.
The portfolio is moderately overweight financial stocks and underweight the more growth -oriented sectors such as information technology and health care. In a strong bull market, the income portfolio will typically lag the market, and in a bear market, it is likely to outperform.
No changes to the portfolio are proposed at this point in time.
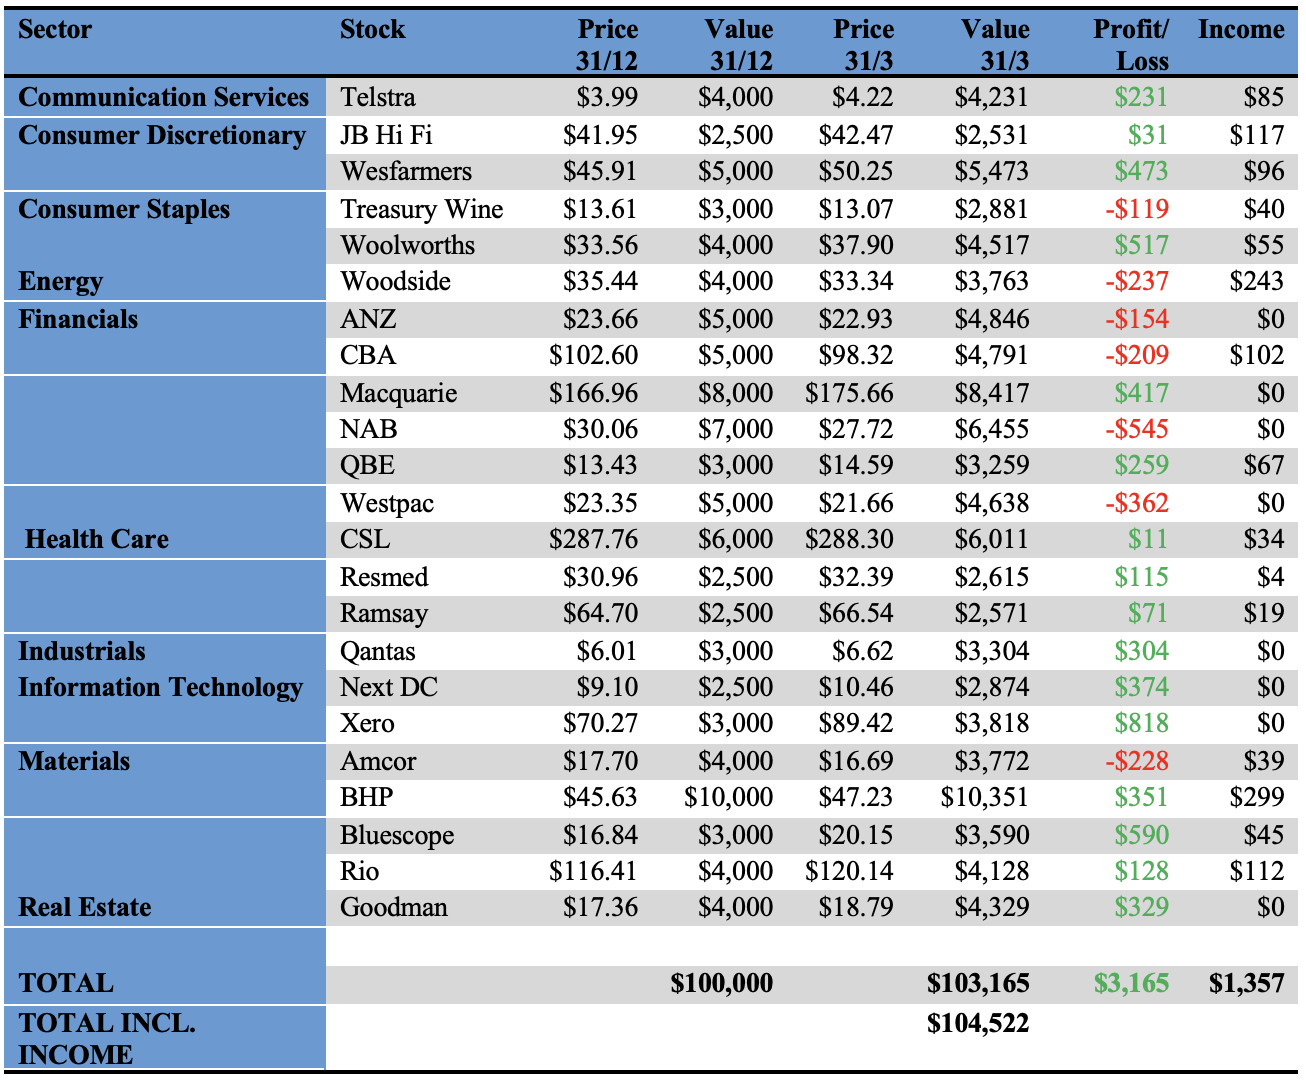
The income-biased portfolio per $100,000 invested (using prices as at the close of business on 31 March 2023) is as follows:
Growth portfolio
The objective of the growth portfolio is to outperform the S&P/ASX 200 market over the medium term, whilst closely tracking the index.
In March, the growth portfolio delivered a flat return (-0.01%) to outperform the benchmark index by 0.17%. Year to date, it has returned 4.52%, outperforming the benchmark by 1.06%.
The portfolio is moderately overweight financials, health care and information technology. It is moderately underweight industrials, real estate and utilities. Overall, the sector biases are not strong.
No changes are proposed to the portfolio at this point in time.
Our growth-oriented portfolio per $100,000 invested (using prices as at the close of business on 31 March 2023) is as follows:
Important: This content has been prepared without taking account of the objectives, financial situation or needs of any particular individual. It does not constitute formal advice. Consider the appropriateness of the information in regards to your circumstances.