March was the worst month for the share market in more than a decade and our model portfolios got walloped. Quite remarkably given the market volatility, both marginally outperformed the market to finish flat to the index.
The purpose of these portfolios is to demonstrate an approach to portfolio construction. As the rule sets applied are of critical importance, we provide a quick recap on these. Because some of the investment assumptions are now invalid, we have made some small changes to the portfolios.
It is important to note that these portfolios are designed as “long only”. They don’t allocate to “cash” and don’t represent a view about the outright direction of the market.
Portfolio recap
In January, we made some adjustments to our Australian share ‘Income Portfolio’ and ‘Growth Portfolio’ (see https://switzersuperreport.com.au/our-portfolios-for-2020/ [1])
The construction rules for the portfolios are:
- We use a ‘top down approach’ looking at the prospects for each of the industry sectors;
- For the income portfolio, we introduce biases that favour lower PE, higher yielding sectors;
- So that we are not overly exposed to a market move, in the major sectors (financials and materials), our sector biases will not be more than 33% away from index. For example, the weighting of the ‘materials’ sector on the S&P/ASX 200 is currently 18.1%, and under this rule, our possible portfolio weighting is in the range from 12.1% to 24.2% (i.e. plus or minus one third or 6.1%);
- We require 15 to 25 stocks (less than 10 is insufficient diversification, over 25 it is too hard to monitor), and have set a minimum stock investment size of $3,000;
- Our stock universe is confined to the ASX 100. This has important implications for the growth portfolio, because the stocks with the best medium term growth prospects will often come from outside this group (the so called ‘small’ caps);
- We avoid stocks from industries where there is a high level of exogenous risk, such as airlines;
- For the income portfolio, we prioritise stocks that pay fully franked dividends and have a consistent record of paying dividends; and
- Within a sector, the stocks are broadly weighted to their respective index weights, although there are some biases.
Overlaying these processes are our predominant investment themes for 2020, which we expected to be:
- A positive lead from the US markets. While the gains of 2019 are unlikely to be repeated, the US election in November means that President Trump will favour market supportive policies;
- Trade tensions between the USA and China to ease (or at least be put on hold);
- Modest economic growth in the USA, with Europe remaining relatively moribund and growth in China moderating;
- In Australia, economic growth to ease to around 2%, with no real pick up in domestic inflation;
- Interest rates in Australia to remain ultra-low, while in the USA, the Fed will delay any hike until 2021;
- The oil price to be well supported above US$50 per barrel as OPEC “manages” production to meet demand;
- Iron ore and metal prices to soften;
- The aussie dollar to remain range bound around 70c but with some risk of breaking down;
- Ultra-low interest rates to continue to support the recovery in the Australian housing market; and
- Following on from 2018 and 2019, quality stocks with both top and bottom line growth will get even more expensive.
Apart from the assumption on economic growth, the assumption about the oil price (that is, OPEC would be able to manage production to meet demand) is proving to be the “most wrong”. Accordingly, we have decided to reduce our weighting to energy companies.
Performance
The income portfolio to 31 March has lost 23.27% and the growth oriented portfolio has lost 23.13% (see tables at the end). Compared to the benchmark S&P/ASX 200 Accumulation Index (which adds back income from dividends), both portfolios are essentially flat for the year (very marginal underperformance of 0.17% and 0.03% respectively).

All sectors in the red, but healthcare still positive for the year
Despite the market losing a little over 23%, the health care sector is still positive for the year with a return of 2.1%. This is mainly due to leaders CSL and Resmed. All other sectors are negative.
Energy stocks have lost almost 50% as the oil price has collapsed. Real estate (which is largely real estate investment trusts) has also come under pressure, losing 34.8%. Rent holidays, higher leverage, and reduced demand are contributing to the malaise, with shopping centre/retail focussed trusts the most exposed.
The financial sector, which makes up 27.6% of the S&P/ASX 200 by market weighting, has also suffered as investors fear an increase in bad debts. The sector lost 27.6% in March and is down 28.0% for the year.
Defensive sectors utilities and consumer staples performed better, losing just 6.2% and 3.6% respectively. With the iron ore price proving to be resilient, iron ore majors BHP, Rio and Fortescue provided sold support to the materials sector allowing it to keep losses to 13.1% in March.
Performances of the 11 industry sectors, together with their respective market weights, are set out in the table below.

Income portfolio
The objective of the income portfolio is to deliver tax advantaged income whilst broadly tracking the S&P/ASX 200.
On a sector basis, the biases for the income portfolio in 2020 are fairly minor. It is moderately overweight financials and underweight health care (where there are no medium or high yielding stocks in the ASX 100).
In the expectation that interest rates in Australia are staying at record low levels, it has a defensive orientation and a bias to yield style stocks.
The income portfolio was forecast to generate a yield on its opening value of 4.65%, franked to 78%. So far, it is on track with an income return of 1.15% (franked at 90.2%), but if the virus slowdown continues, dividends are likely to be cut and the forecast will prove to be too optimistic.
In March, the income portfolio gave up 20.25% for a relative outperformance of 0.43%. This is measured on a total return basis which includes dividends. Material underperformers included energy companies Santos and Woodside, Dexus, and some of the major banks. The major materials companies held up well, as did CSL and Medibank.
Clearly, the assumption we made about the oil price is invalid and the sector exposure is overweight. Dividends for some energy companies will also be off the table. Accordingly, we have decided to realise the loss on Santos and propose to reinvest the net proceed of $1,672 into additional Woolworths shares.
No other changes are proposed at this point in time.
The income biased portfolio per $100,000 invested (using prices as at the close of business on 31 March 2020) is as follows:
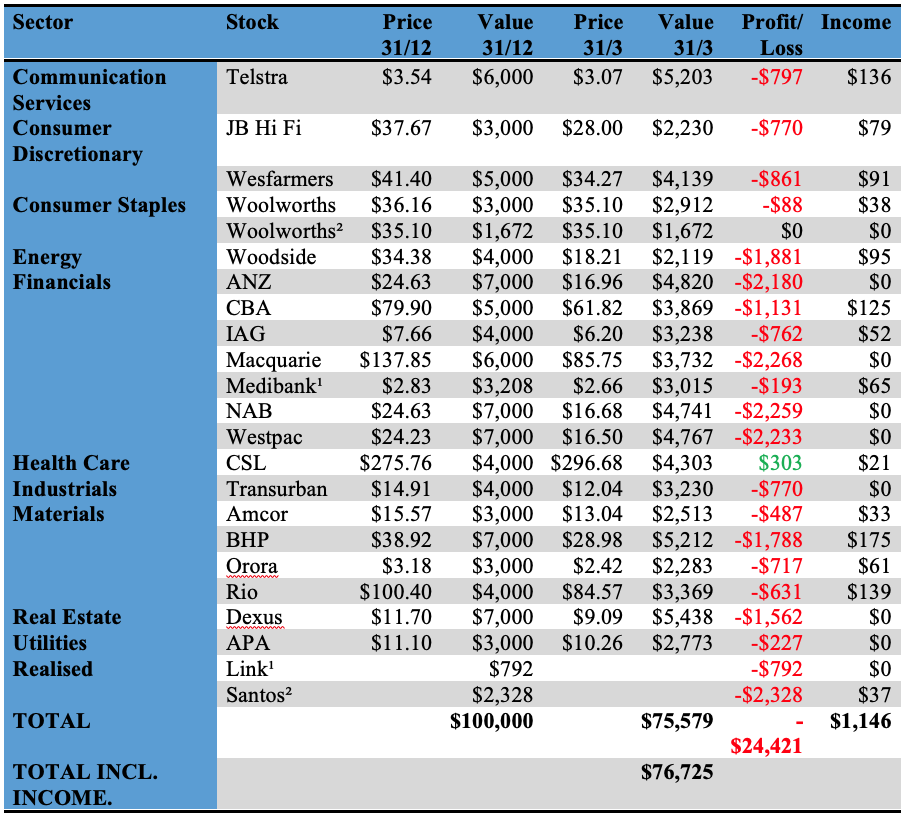
¹ Link sold on 28 Feb at $4.70 to realise loss of $792. Net proceeds of $3,208 invested in Medibank at $2.83 (cum-dividend
² Santos sold 31 March at $3.42 to realise loss of $2,328. Net proceeds of $1,672 invested in Woolworths at $35.10
Growth portfolio
The objective of the growth portfolio is to outperform the S&P/ASX 200 market over the medium term, whilst closely tracking the index.
The growth portfolio in 2020 is moderately overweight health care, energy, consumer discretionary and information technology. It is underweight consumer staples, real estate and utilities. Overall, the sector biases are not strong.
On a stock selection basis, it also has a bias to companies that earn revenue outside Australia and should benefit from a weaker Australian dollar.
In March, the growth portfolio gave up 19.73% for a relative outperformance of 0.95%. This is measured on a total return basis which includes dividends. Material underperformers included the energy companies Santos and Woodside, Aristocrat Leisure, and the major banks and Macquarie. This was offset to a limited extent by the strong performance of Resmed and A2 Milk. CSL also held up well.
The assumption we made about the oil price is invalid and the sector exposure is overweight. Accordingly, we have decided to realise the loss on Santos. The case for what to invest in is less clear, but given that we are underweight the consumer staples sector and Woolworths has cheapened relative to Coles, we propose to invest the net proceeds of $1,672 into Woolworths shares.
No other changes are proposed at this point in time.
Our growth oriented portfolio per $100,000 invested (using prices as at the close of business on 31 March 2020) is as follows:
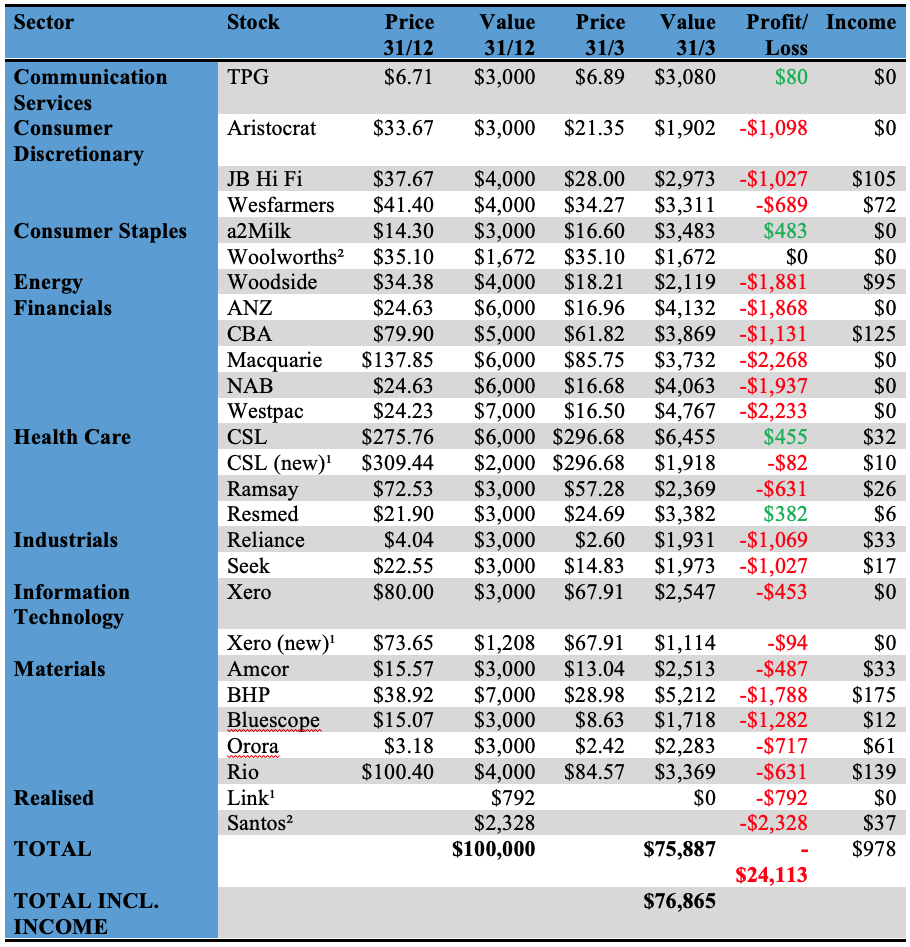
¹ Link sold on 28 Feb at $4.70 to realise loss of $792. Net proceeds of $3,208 invested in $2,000 CSL at $309.45 and $1,208 Xero at $73.55.
² Santos sold 31 March at $3.42 to realise loss of $2,328. Net proceeds of $1,672 invested in Woolworths at $35.10
Important: This content has been prepared without taking account of the objectives, financial situation or needs of any particular individual. It does not constitute formal advice. Consider the appropriateness of the information in regard to your circumstances.