While not as strong as the gains in the USA, the Australian share market rose in March to close at another record high. Overall, the market added (with dividends included) 3.3% in March to take the first quarter’s total return to 5.3%. Our model portfolios, particularly the growth portfolio with its exposure to information technology stocks, continued to outperform.
At the beginning of the year, we updated our portfolios for 2024. There are two model portfolios – an income-oriented portfolio and a growth portfolio. The objectives, methodology, construction rules and underlying economic assumptions can be referenced here: (see:
https://switzerreport.com.au/advice/model-portfolios/ [1] )
These are long-only model portfolios, and as such, they are assumed to be fully invested at all times. They are not “actively managed”, although adjustments are made from time to time.
In this article, we look at how they have performed so far in 2024. To do so, we will start by examining how the overall market has fared.
Small and mid-caps lead
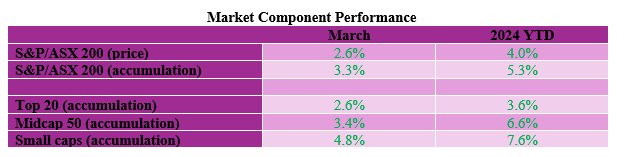
The tables below show the performances in March of the components and industry sectors that make up the Australian share market. Stocks outside the “top 20” are in aggregate doing better than the large cap stocks. Smaller cap stocks, as measured by the Small Ordinaries Index which tracks stocks ranked 101st to 300th by market capitalization, recorded a gain of 4.8% for the month, which took the year to date return to 7.6%. Midcaps, as measured by the Midcap 50 index which tracks stocks ranked 51st to 100th by market capitalisation, added 3.4% in the month whereas the top 20 stocks added 2.6%.
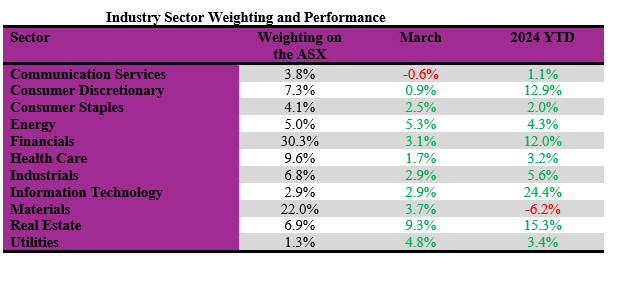
With the industry sectors, information technology recorded a smaller gain in March of 2.9% but is up a remarkable 24.4% in calendar 2024. All other sectors except consumer services recorded gains in the month, with real estate doing the best on the back of lower interest rates, adding an impressive 9.3%.
The largest sector by market weight, financials, which makes up 30.3% of the overall S&P/ASX 200 index, added 3.1% in March and now boasts a positive return of 12% in 2024. On the other side of the ledger, the second largest sector by market weight, materials, is the only sector in the red for 2024 with a loss of 6.2%.
Portfolio performance in 2024
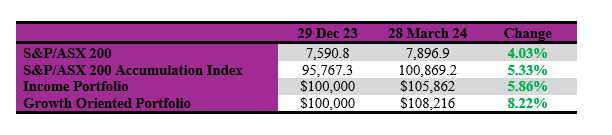
The income portfolio to 28 March has returned 5.86% and the growth-oriented portfolio has returned 8.22% (see tables at the end). Compared to the benchmark S&P/ASX 200 Accumulation Index (which adds back income from dividends), the income portfolio has outperformed by 0.53% and the growth portfolio by 2.89%.
Income portfolio
The objective of the income portfolio is to deliver tax advantaged income whilst broadly tracking the S&P/ASX 200. The income portfolio is forecast to deliver an income return of 4.6% (based on its opening value at the start of the year), franked to 78.2%. After three months, it has delivered 1.49% which is franked at 92.6%.
The portfolio is moderately overweight financial stocks and energy and underweight the more growth oriented sectors such as information technology and health care. It is also underweight real estate (incl. property trusts). In a strong bull market, the income portfolio will typically lag the market, and in a bear market, it is likely to outperform.
In the month of March, the income portfolio returned 3%, moderately underperforming the benchmark index by 0.27%. Year-to-date, the portfolio has returned 5.86%, outperforming the benchmark index by 0.53%.
No changes to the portfolio are proposed at this point in time.
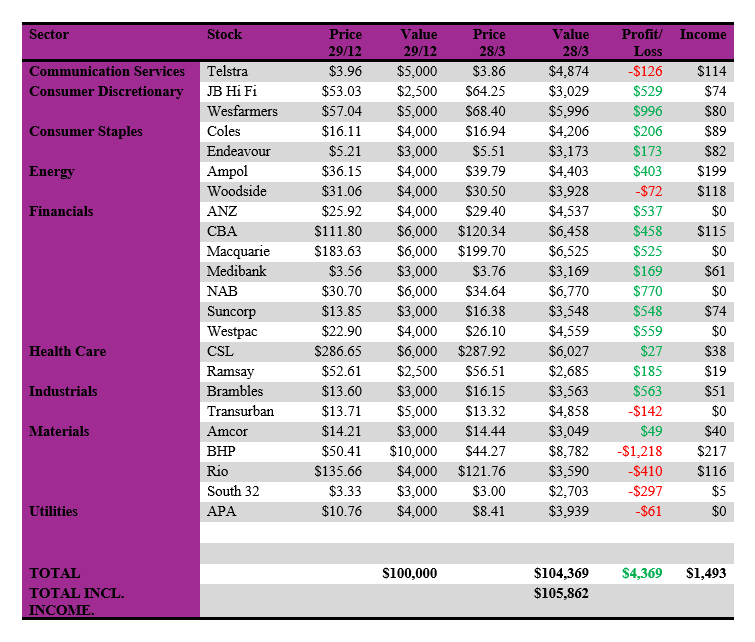
The income-biased portfolio per $100,000 invested (using prices as at the close of business on 28 March 2024) is as follows:
Growth portfolio
The objective of the growth portfolio is to outperform the S&P/ASX 200 market over the medium term, whilst closely tracking the index. The portfolio is moderately overweight materials, health care and information technology. It is moderately underweight financials, industrials, real estate, and utilities. Overall, the sector biases are not strong.
In the month of March, the portfolio returned 2.88%, moderately underperforming the benchmark index by 0.39%. Year to date, the portfolio has returned 8.22%, outperforming the benchmark index by 2.89%.
No changes are proposed to the portfolio at this point in time.
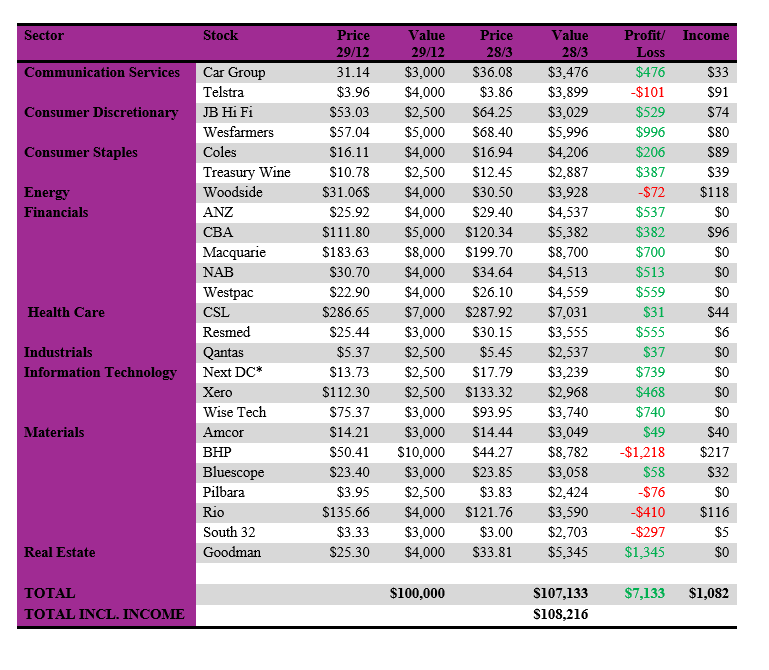
Our growth-oriented portfolio per $100,000 invested (using prices as at the close of business on 28 March 2024) is as follows:
Important: This content has been prepared without taking account of the objectives, financial situation or needs of any particular individual. It does not constitute formal advice. Consider the appropriateness of the information in regards to your circumstances.