The end of 2018 was a terrible one for share markets. Rising US interest rates and trade tensions among other things saw the S&P/ASX 200 fall nearly 900 points from peak to trough. On Christmas Eve, the Australian share market hit an intraday low of 5410.2. Since then however, we have screamed higher, trading near 6100, or more than 11% above those December lows.
Often when share markets recover in a V-shaped manner, they then go back to retest their prior low. That is, after an initial bounce, there was a chance that our market would go back towards those December lows one final time. If that were to occur, does that mean we are heading under 5400, or would any dip in the share market be shallower in nature? To answer that, we simply need to look at how the market has traded since those December lows. If price action has been strong, then there is less chance of heading much lower.
Firstly, we need to look at the S&P/ASX 200 in the form of a daily candlestick chart.
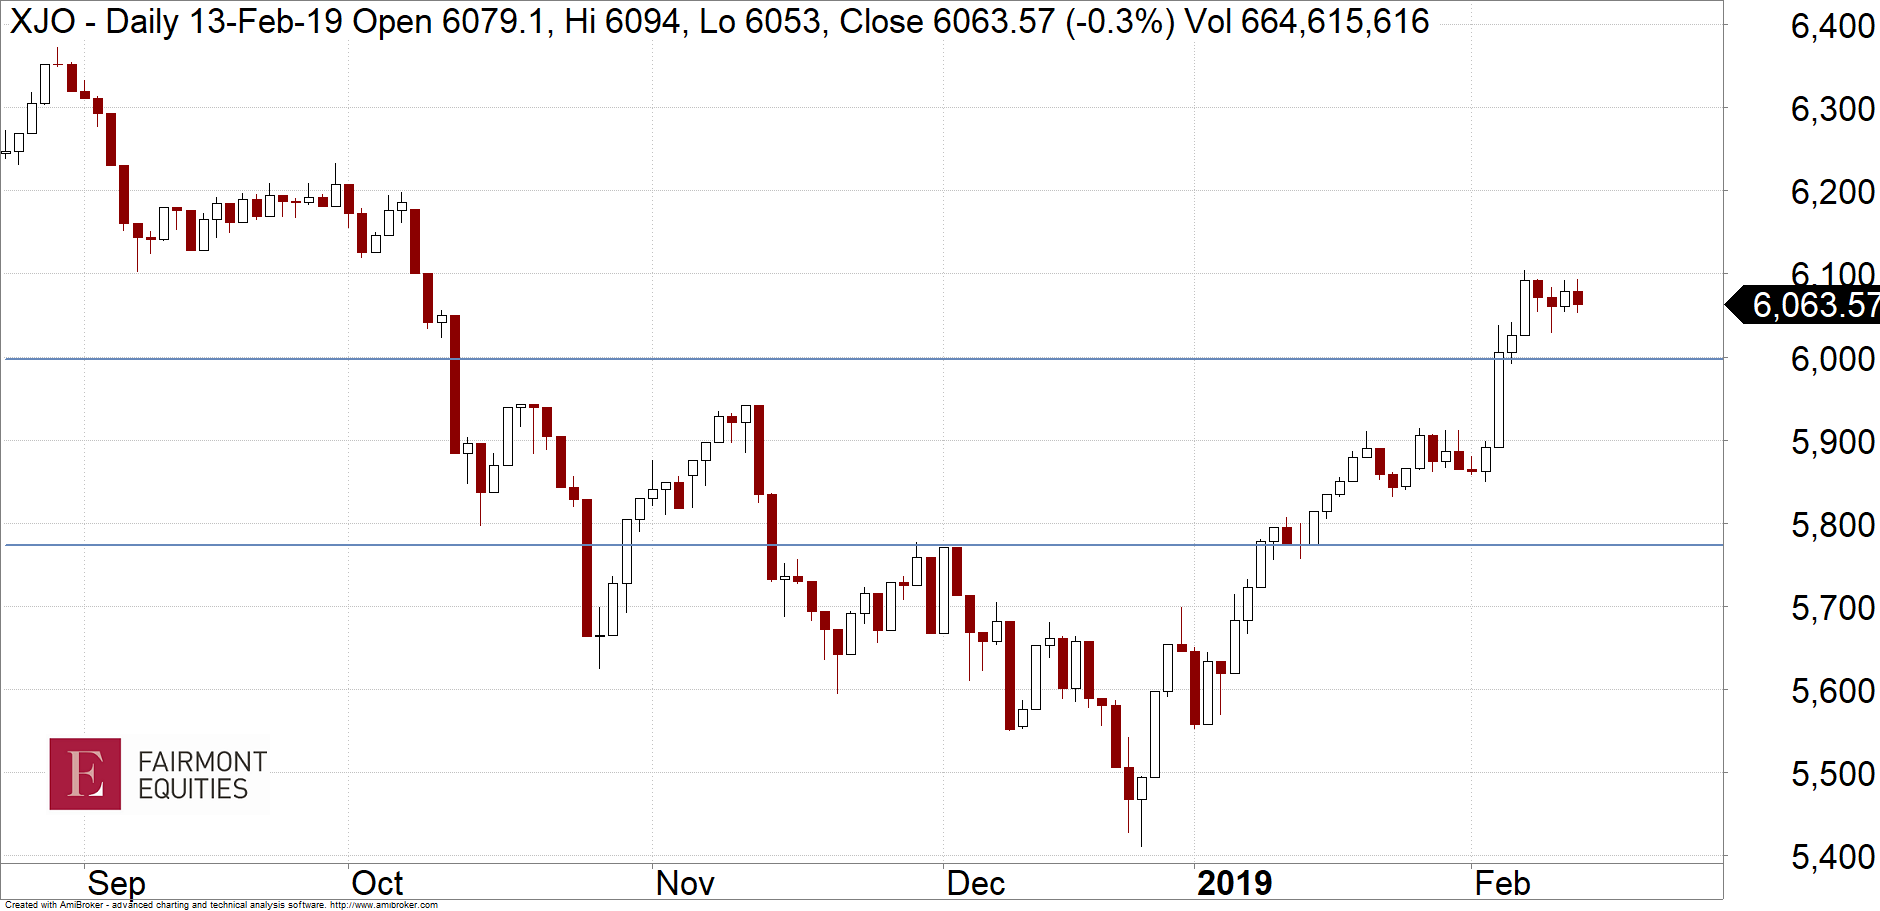
From the chart above, each of these candles represents one day’s worth of trading. A white candle is an “up” day on the market, the red one is a “down day”. The first thing you will notice is the amount of large white candles since the December lows in comparison to the red candles. This is indicating that there is a lot of strength in the daily moves of the market. The other thing to pay attention to is how far our market has retraced the sell off from last year. That is, if our market fell 900 points, then several weeks later you would want to see it recover a decent amount of ground. Chartists often look at levels known as Fibonacci retracements. The two horizontal lines represent two of these levels. The lower one is the 38.2% retracement and the higher one is the 61.8%. Effectively, it just shows us how much of the 900 points we have recovered. If our market was languishing under the 38.2% retracement line, muddling around levels near 5700, then I would be worried. However, the S&P/ASX 200 is above the higher level. That is, we have recovered most of that 900-point fall in the space of several weeks. That is a sign of strength and tells me that any dips in the share market will be shallow. That is, any dips from here may only be in the order of a few hundred points. So a move back towards the December lows now appears unlikely.
If you are still in doubt about whether this rally is the real deal, then let me leave you with one more thing. A recent strategy note by Bank of America Merrill Lynch showed the results of a survey of investors with US$515 billion. It indicated a net allocation to cash of 44%. This is the highest amount since the 2009 global financial crisis. What this means is that the share market is not a crowded trade with investors looking to sell the rally. It means that there is a lot of cash on the sidelines, ready to find a home.
Important: This content has been prepared without taking account of the objectives, financial situation or needs of any particular individual. It does not constitute formal advice. Consider the appropriateness of the information in regard to your circumstances.