“I’ve seen a vision of the future…” and it’s very positive for stocks. Now this isn’t my vision, and, best of all, it’s supplied by a man known for his realistic views on the subject of the economy and markets.
Percy Allan was a former New South Wales Treasury boss and put together an initiative that we supported called Market Timing. Regrettably, not enough investors were into getting insights when a market would crash or zoom off!
That said, critics of market timing indicator watchers could ask: “Did they see this Coronavirus crash coming?”
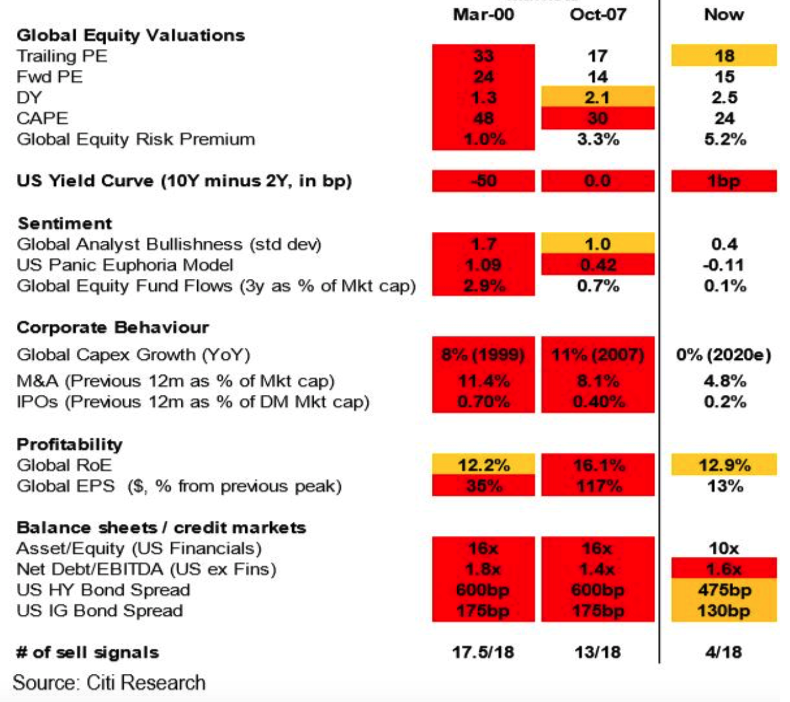
The cynic has a case with this one, as the virus-created pandemic and recession was from the furthest imaginable left-field ever! However, the Citi Bear Market checklist, which I watch closely, shows two important things that critics of market timing should remember.
First, on the list of indicators that Citi’s smart market team watches, it doesn’t have anything like “pandemic threat” that has been an issue for markets in the past.
Second, before the recent stock market crash, only four out of 18 indicators screamed get out of stocks. Before the dotcom crash, it was 17.5/18. And before the GFC, it was 13/18. And with the latter case, the debt ratings agencies didn’t tell us about their false rating on the exotic investment products (called CDOs), which rattled financial markets into a death spiral, taking stocks down 50%!
If they did tell us the truth, that number might have been 15 out of 18, and the cautious market-timer might have gone to cash or at least defensive. Back then, one-year term deposit rates were 6%!
From my point of view, when it comes to investing, I take in many different points of view, and if I get a strong coincidence either to the positive or negative, I buy or sell.
For example, if I see a company in a growing industry, with good management, a leader in its sector and where the technical or charts tell me that the market is loving this company, I’m really inclined to go long that business, and vice versa.
So when Percy writes that “this week it happened — the All Ords share index’s 30-day trend line surpassed its 300-day trendline, suggesting it’s ‘all over rover’ for the bear market,” I have to take him seriously.
This is the sort of stuff Percy throws at you: “When the Coppock momentum indicator turns up it should confirm that the crash of February/March is behind us and the market’s bull rally since March 23rd is supported by not only by trend analysis, but also momentum analysis.”
But what is the Coppock indicator? Investopedia says: “The Coppock Curve is a long-term price momentum indicator used primarily to recognize major downturns and upturns in a stock market index. It is calculated as a 10-month weighted moving average of the sum of the 14-month rate of change and the 11-month rate of change for the index.”
On closer reading, Percy is saying that the shorter-term reading of six months is more positive about the death of the bear market than the longer 12-month graph but it still is pretty positive.
The chart below takes in the 12-month story. But don’t be unsettled if it looks like Double Dutch to you. (Can we say that kind of thing nowadays?)
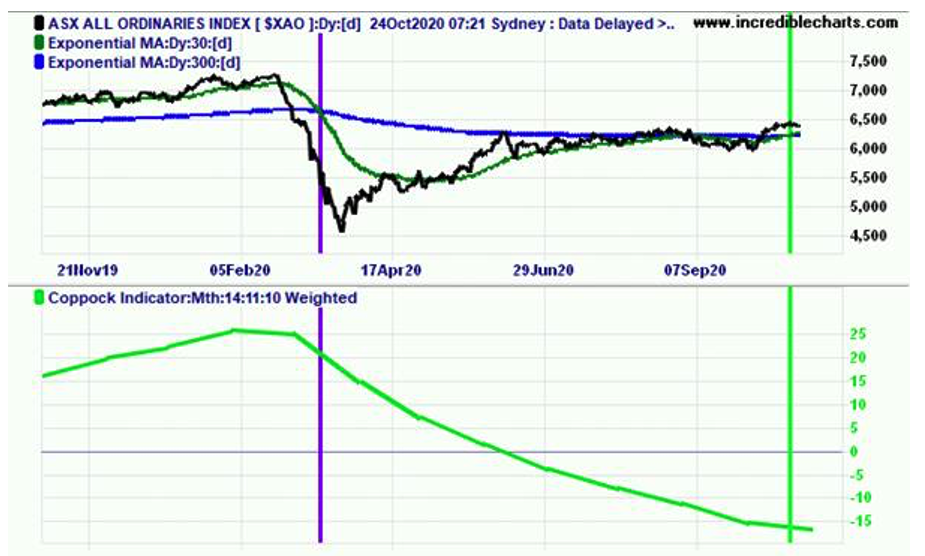
The green line is the Coppock indicator and it does look like it’s trying to turn up after sliding big time since late February. “On short-to-medium-term trend analysis the All Ords index remains bullish, but its momentum is slowing,” Percy noted. “Its 10-day trendline sits comfortably above its 30-day one, but it MACD oscillator while still positive is quickly losing momentum.”
The MACD Oscillator? Investopedia says the Moving Average Convergence Divergence is “is a double-edged technical indicator in that it offers traders and analysts the ability to follow trends in the market, as well as gauge the momentum of price changes, to spot trends in the market, anticipate potential shifts in trading, and, ultimately to either trade successfully or to offer advice to clients so that they may trade successfully.”
Don’t worry if Percy and I are losing you, I just want to show how smart he is and how I try to get you really important information to help you invest well.
As a consequence, let me give you a summary of Percy’s findings about the end of the bear market (with my comments in bracket).
So here goes:
- America’s S&P500 index while still bullish is less so than Australia’s All Ords index. (US infection rates and the stimulus/election question marks aren’t helping Wall Street or the US economy.)
- The Democrats look likely to win the US election, though Biden’s lead “in the key swing states is only 4 percentage points.” However, in the Senate race, “it’s neck and neck between the Republicans and the Democrats with nine states in doubt.”
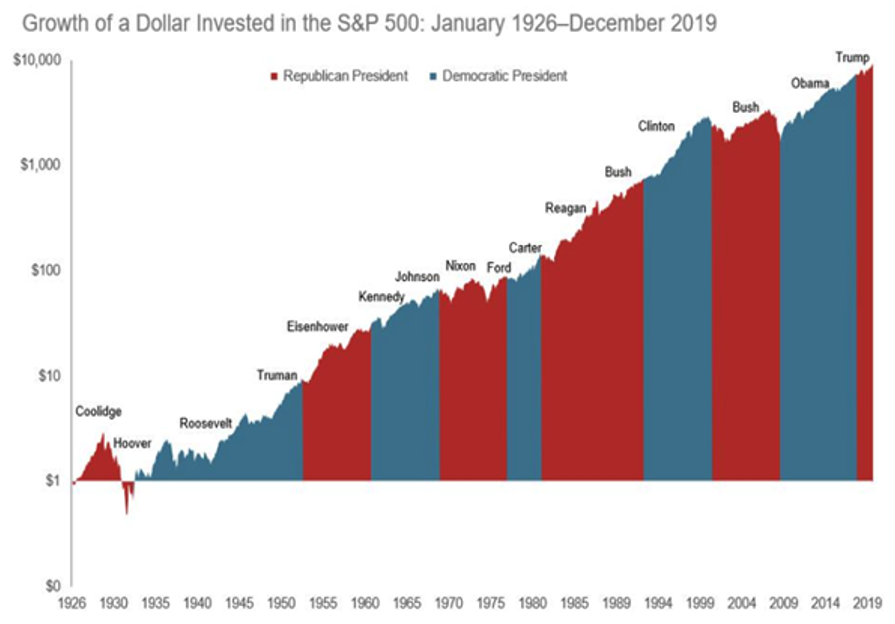
Source: S&P data © 2020 S&P Dow Jones Indices LLC, a division of S&P Global. All rights reserved.) Dimensional Fund Advisers.
- Historically, Democrat Presidents (shown in blue in chart above) have always presided over secular bull markets except for Roosevelt in the latter half of the 1930s.
- Wall Street is warming to a Biden Presidency with their expected big spending being more relevant with interest rates so low, which takes away fire power for central banks and their monetary policies worldwide.
Last week, Percy points out, “Goldman Sachs, the world’s second-largest investment bank, advised its clients that a “congressional Democratic majority would likely result in substantially more fiscal support. We expect that spending would increase the most under a Democratic sweep of the House, Senate and White House.”
It said its research showed that the boost to U.S. economic growth from fiscal stimulus favoured by the Biden campaign would “outweigh the negative effects of tax increases, particularly in light of the fact that the increased tax revenue would go to funding new spending.”
- The prospect of a Democrat victory has helped bond market yields rise, implying that great growth should bring more inflation and even higher interest rates. (Have a look at my interview with Chris Joye on tonight’s Switzer TV Investing program, who is very bullish on 2021 generally, house prices, bank stocks and even their dividends!)
- All this points to a turning point for stocks, which would mean kissing goodbye to the bear market and welcoming in a secular bull market. (Secular bull and bear markets can have cyclical or shorter bull and bear markets.)
Whatever the nagging issues for the US and Wall Street are right now, which includes the stimulus stalemate, the election and the rising COVID-19 infections, Percy states firmly that “both short-to-medium-term and medium-to-long term trend analysis now suggest the Australian All Ords index is in a bull market.”
Why are we so much better off? Try these things:
- We have our stimulus package — a Budget Deficit of $213.7 billion.
- Interest rates are unbelievably low.
- China, our most important trading partner, is out of recession.
- We’re expected to grow by 4.25% in 2021 after contracting by 3.75% this year.
- Victoria aside, we’ve been world-beaters in tackling the Coronavirus.
Go Percy and I hope you’re on the money!
Important: This content has been prepared without taking account of the objectives, financial situation or needs of any particular individual. It does not constitute formal advice. Consider the appropriateness of the information in regard to your circumstances.