It was a ‘nothing really happening’ week for stocks but you have to accept that there’s no real appetite to sell off. That has to be a good thing for those on board with my general optimism towards stocks for 2017 and 2018.
Friday gave the S&P/ASX 200 index a 0.2% gain and, in case you missed it, we were up 0.4% for the week.
The quiet, big story of the week was the 4.3% rise for the materials sector.
BHP was up 4.3% for the week, while Rio added a big 6.7% and South 32 put on 5.3%. Why was the latter dumped by BHP? CEO fallibility?
It makes me wonder about BHP’s CEO’s less than positive call on the iron ore price going forward.
By the way, Morgan’s chief economist, Michael Knox, who actually models iron ore prices (and few economists do that) has a pooh pooh on the lower forecasts, such as US% 50 a tonne for iron ore, thinking it will be more like $75.
Go Knoxy!
This great news for material stocks was helped by a slightly lower dollar connected to the Fed’s apparent commitment to only three rate rises in 2017, instead of a possible four, if you can believe the dot plots of the voting members who determine US interest rates.
The currency impact aside, I like the market developments that say “buy material stocks” and I’m hoping it’s linked to what the global economy will ultimately do in 2017.
My bullishness has been helped by Bell Potter’s Richard Coppleson, who predicts we’ll see 6000 on the S&P/ASX 200 index within six weeks.
“This time we have everything lined up for this final assault on the 6000 level,” Mr Coppleson said. “But when it gets there – driven by momentum as well – it may be the time to sit back and lock in some gains – but we’ll deal with that problem in the future.” (SMH)
In fact, for over a year, miners have had the luck of the Irish and given that it’s been St. Patrick’s Day in the US, we’d expect to see green on screen! That said, financials and healthcare stocks struggled, while utilities had a good day at the office on Wall Street.
Reasons for this market to go much higher right now seem thin on the ground and it’s why I hope Coppo is right.
Go Richard!
Also, it has been the quadruple witching hour for US stocks, when on the third Friday of every March, June, September, and December, there is the expiration of three related classes of options and futures contracts, along with individual stock futures options.
It can make for some interesting market developments in either direction.
Back home, if you missed my TV shows this week (why would any rational wealth-builder do that?), stocks that got a favourable mention this week include:
- Amcor and Spark from Investor Mutual’s Anton Tagliaferro.
- G8 Education is becoming a bit of a whisper.
- Michael McCarthy of CMC is wary of Telstra but likes Domino’s at $45 but says he’s starting to nibble at current prices, even if it goes lower.He also still likes the growth stocks, such as BHP!
What I liked
- The Fed’s decision was the right one, hinting at three rate rises in 2017 rather than a possible four. Why KO the US economy on Trump promises? If he delivers, then rate rises can be reassessed.
- Locally, full-time jobs rose by 27,100 and while part-time jobs fell by 33,500, it has to be a better trend with full-time in and part-time out.
- On the jobs data, this from CommSec’s Craig James: “It would be easier to accept the latest jobs data if it lined up with other evidence. But it doesn’t. There have been healthy business surveys in recent months, with the NAB business conditions index hitting 9-year highs in January. Mining prices have lifted, the agricultural sector is buoyant, tourist arrivals are at record highs and more homes are being built than ever before. Certainly, leading indicators like job ads are pointing higher rather than lower. And low real unit labour costs give employers plenty of reasons to be taking on staff. Investors are best advised to move on and focus on the next major economic data, which is retail trade, released on April 3.”
- The NAB business conditions index eased from a 9-year high of +16.3 points to +9.3 points in February. The business confidence index eased from a 3-year high of +9.7 points to +6.9 points. (I didn’t like the falls but the levels are still way higher than the long-term averages and monthly figures are often suss!)
- In the US, the business roundtable CEO index posted the biggest increase in the March quarter survey in eight years.
- More from the US and new job openings, as measured by the JOLTS survey, rose from 5.501 million to 5.626 million in January. Housing starts rose 3% to a 1.288 million annual rate in February (forecast 1.26 million). New claims for unemployment insurance fell 2,000 to 241,000 in the latest week (forecast 240,000).
- Investors were heartened by the Dutch election result, where centre-right Prime Minister, Mark Rutte, retained power.
- In China, retail sales rose 9.5% in January/February compared with a year ago. Industrial production was up by 6.3% over the year and investment was up by 8.9%.
What I didn’t like
- The NAB rate rise was OK because their rates were below the other big four banks but the Westpac rise was unnecessary, except for its bottom line and profitability. Lucky I’m a shareholder but not a borrower!
- The rise in unemployment from 5.7% to 5.9% and what it implies, with the media playing up the negativity angles they do so well.
- In the US, the Philadelphia Federal Reserve business index eased from 43.3 to 32.8 in March (forecast 30.0), which could be a rogue number but it should be watched.
- For those like me who think old world conventional retailers have a tough road to hoe, the news that JCPenney is shutting up to 140 stores looks ominous.
- The higher Aussie dollar – up 1.7% for the week – following the Fed’s decision not to be too bolshy on rate rises in 2017. Was it a trick to give the US a currency manipulation advantage? No, Donald would never accept such a thing! Not!
Another good’un from Craig James
“Last week, dividends started flowing from those companies that reported early in the recent earnings (profit-reporting) season. Conservatively around $22 billion (or around 1.3% of GDP) will be paid out by companies over the next few months.”
In addition, the majority of companies reporting half-year earnings results (88%) chose to pay a dividend and almost 82% of these companies lifted or maintained dividends.
You can see why I love those delightful dividends!
The week in review:
- Could Domino’s be headed to $80 [1]? I revealed what the experts think about the pizza company and others.
- It’s the question everyone’s asking – is Telstra a buy yet [2]? Paul Rickard explains what you need to know about the dividend-paying telecommunications company.
- Following a busy year of floats, James Dunn revealed five newly listed companies [3] to watch that you may have missed initially.
- URB is set to list on the ASX and will invest in a diversified portfolio of equity securities and direct property assets that have exposure to urban renewal and regeneration. Paul Rickard discussed whether an investment in the IPO is worth considering [4].
- With new super rules incoming, SMSFs will have access to Capital Gains Tax (CGT) relief on impacted assets. Melanie Dunn explained everything you need to know [5].
- The brokers placed CSR and Nine Entertainment [6] in the good books this week while Astro Japan was in the not-so-good books. In our second broker report [7], Fortescue and Origin were upgraded while Westfield was downgraded.
- Better strategy and execution fuel optimism as tailwinds drive Australian agriculture. Tony Featherstone says diversification is paying off for GrainCorp. [8]
- Graeme Colley looked at some urban myths that have developed around the upcoming super changes [9].
- We responded to reader queries about ETFs and Wesfarmers [10].
Top stocks – how they fared

What moved the market?
- US Fed’s decision to increase interest rates by 25 basis points to a range of 0.75 to 1%, and their dovish statement that hosed down expectations about the pace of future increases.
- The Dutch general election: Mark Rutte remains Prime Minister, beating far-right candidate Geert Wilders.
- The US Energy Information Administration said on Wednesday that US crude inventories dropped by 237,000 barrels. This was the first decline in nine weeks.
Calls of the week
- Paul Rickard said we should give young adults a hand by allowing them to access part of their super as a deposit for their first home. Read his article [11] on Switzer Daily.
- Fed boss Janet Yellen made the call to raising interest rates in the US by 25 basis points.
- PM Turnbull’s call [12] to get all bullish on some “nation building” infrastructure and back SnowyHydro 2.0.
The week ahead
Australia
- Monday March 20 – CommBank Business Sales index (Feb)
- Monday March 20 – Speech by Reserve Bank official
- Tuesday March 21 – Reserve Bank Board minutes
- Tuesday March 21 – Residential property prices (December)
- Wednesday March 22 – Speech by Reserve Bank official
- Thursday March 23 – Detailed job data (February)
- Thursday March 23 – Population data (September quarter)
Overseas
- Tuesday March 21 – US Current account (December quarter)
- Wednesday March 22 – US Monthly home prices (January)
- Wednesday March 22 – US Existing home sales (February)
- Thursday March 23 – US New home sales (February)
- Friday March 24 – US Durable goods orders (February)
- Friday March 24 – Markit “flash” manufacturing
Food for thought
You can’t build a reputation on what you are going to do.
– Henry Ford
Last week’s TV roundup
- URB, a new LIC that will concentrate on the theme of urban renewal and regeneration, will soon be listing on the market. To discuss, Tom Millner [13] from Contact Asset Management joins Switzer TV. To learn more, click here [14].
- Carlos Gil [15], CEO and CIO of Microequities, joins the show to talk about some of the smaller companies that look like good value.
- Is the stock market becalmed, with no reason to buy and no reason to sell? I discussed this with Charlie Aitken [16] of Aitken Investment Management.
- Who’s right when it comes to commodity prices? I put this to Morgans’ Michael Knox [17].
- How is Investors Mutual’s Anton Tagliaferro [18] playing the stock market right now? To discuss this and companies he’s watching, he joins Super TV.
Stocks shorted
ASIC releases data daily on the major short positions in the market. These are the stocks with the highest proportion of their ordinary shares that have been sold short, which could suggest investors are expecting the price to come down. The table shows how this has changed compared to the week before. This week the biggest mover was Western Areas with a 2.59 percentage point increase in the amount of its shares sold short to 16.36%. WorleyParsons went the other way, with its short position decreasing by 1.35 percentage points to 8.30%.

Source: ASIC
Chart of the week
Fed dot plot reveals lots!
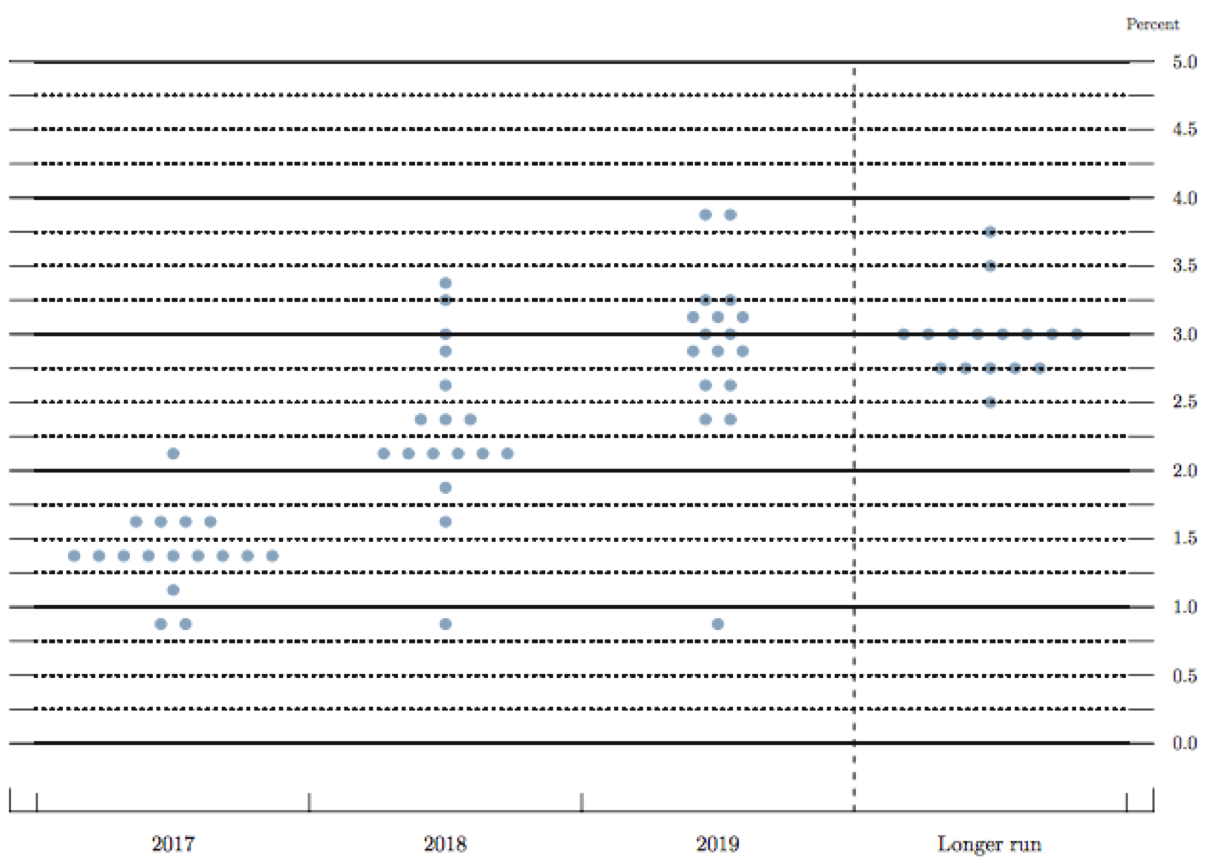 [19]
[19]Source: Federal Reserve
The above chart shows the midpoint of the range each of the US Federal Reserve Governors think interest rates should be at the end of each year up to 2019 and then in the longer run. At the end of this year, the median is 1.4% (implying two more interest rate increases of 0.25% each). By 2019, some policy makers expect rates to be between 3 and 4%.
Top five most clicked stories
- Peter Switzer: Domino’s is an $80 stock! And other expert stock tips! [1]
- Paul Rickard: Is Telstra a buy, yet? [2]
- James Dunn: 5 top floats [3]
- Rudi Filapek-Vandyck: Buy, Sell, Hold – what the brokers say [6]
- Melanie Dunn: Superannuation reform CGT relief: 2 strategies you need to know [5]
Recent Switzer Super Reports
- Monday, 13 March: Big calls [20]
- Thursday, 16 March: Is Telstra a buy? [21]
Important: This content has been prepared without taking account of the objectives, financial situation or needs of any particular individual. It does not constitute formal advice. Consider the appropriateness of the information in regards to your circumstances.