Australia’s All Ords share price index rose strongly between Friday 2 and Tuesday 13 October. Its red 10-day trendline overshot its 30-day green trendline thereby restoring its bullish status over the short-to-medium-term.
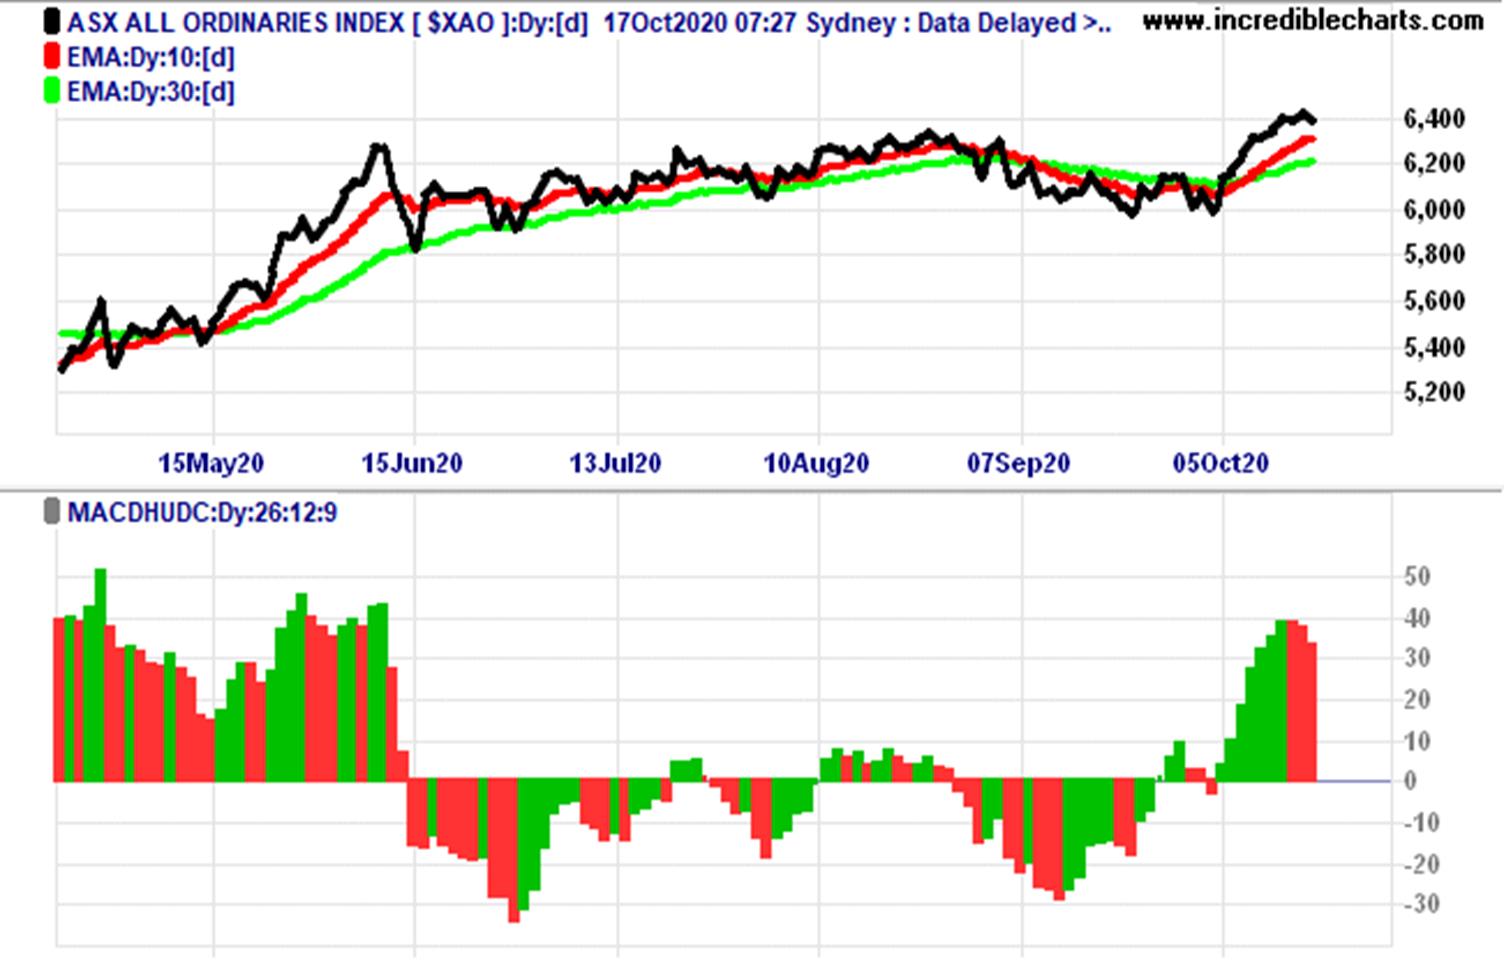
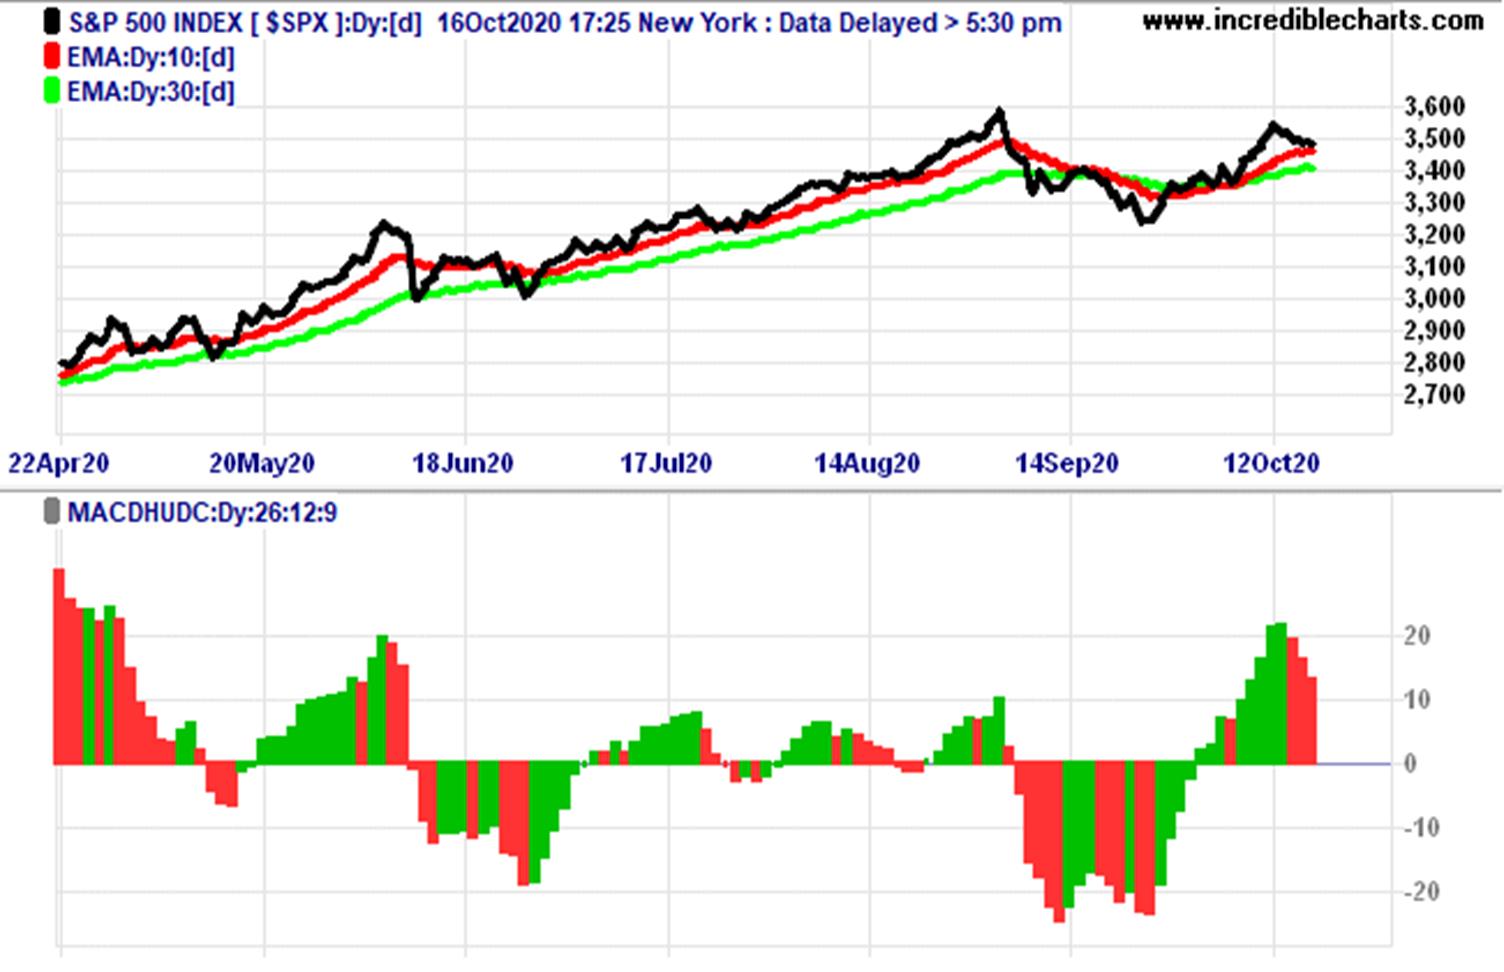
The chart below shows that America’s S&P 500 share price index is following a similar path to the Australian All Ords index. As I have said many times, the ASX more often than not takes it cue from Wall Street.
The most important development in the last week is that the All Ords index is on the cusp again of going bullish on a medium-to-long-term basis. Its green 30-day trendline is breaching its blue 300-day trendline.
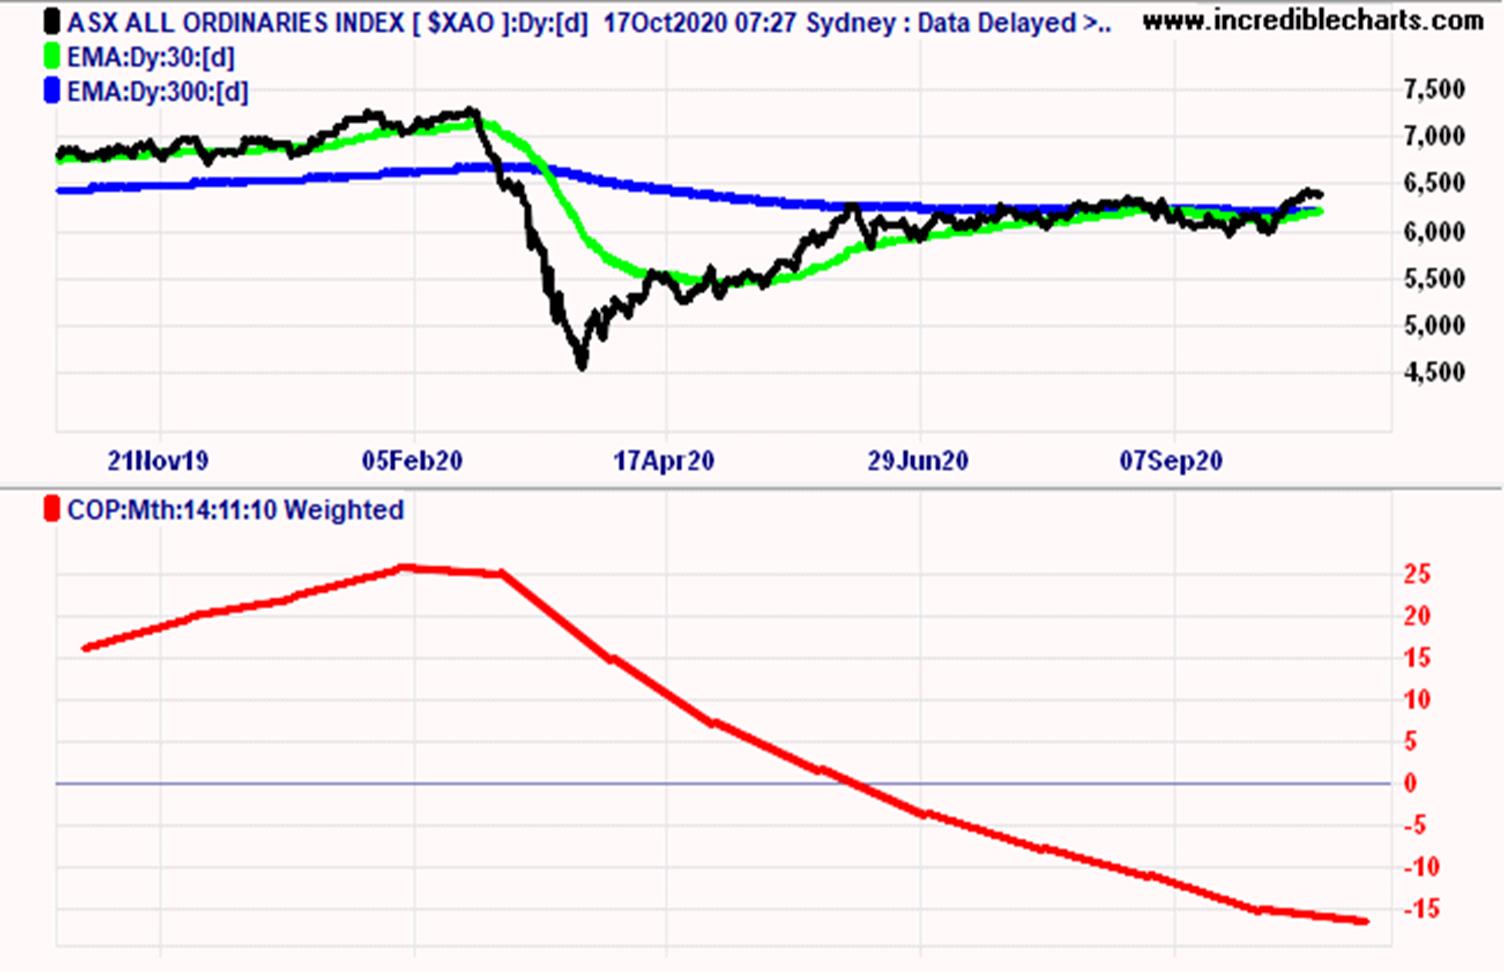
The last time it did that was on Thursday 3 September, but it then pulled back. See next chart. If the green line makes a clean break above the blue line on this occasion, then Australia’s bear market will be over not just on short-to-medium-term trend analysis, but also on medium-to-long-term trend analysis.
However, an ominous sign is that the All Ords index, like the S&P 500 index, lost significant momentum in the last three days of last week. If this continues it might be a repeat what happened in early September when the medium-to-long-term trend bear market refused to go bullish. The next week should decide one way or the other.
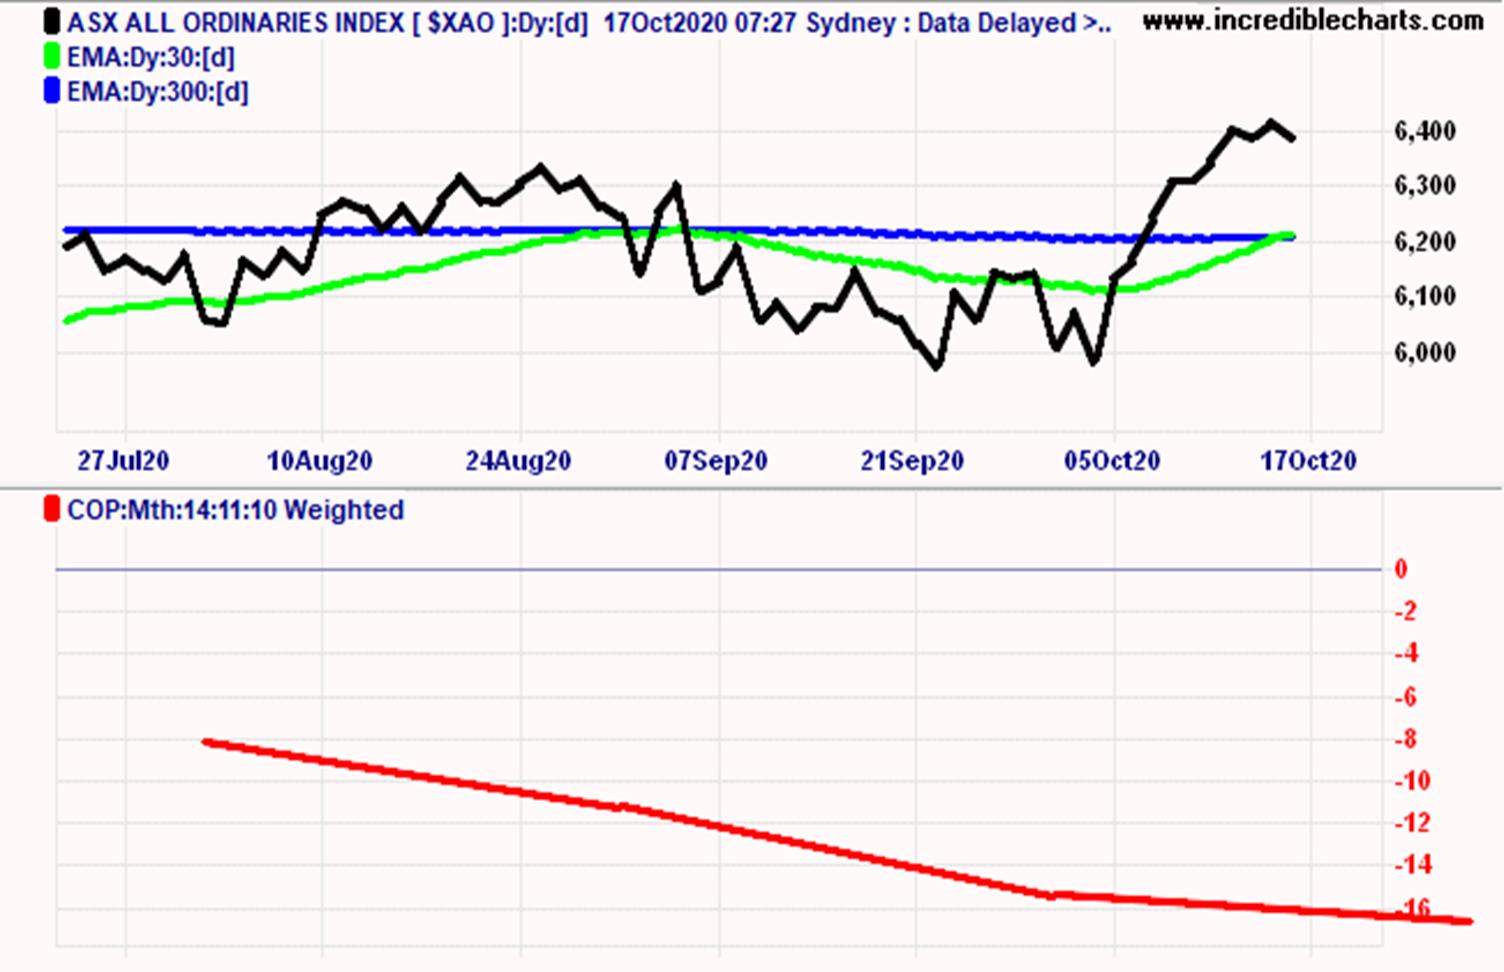
The following chart shows what is happening on weekly movements of the All Ords index. The sideways meandering pattern of the index since early June clearly has an upward tilt which is encouraging. Until two weeks ago that was not clear because the index had slumped back to where it almost was on the 12 June.
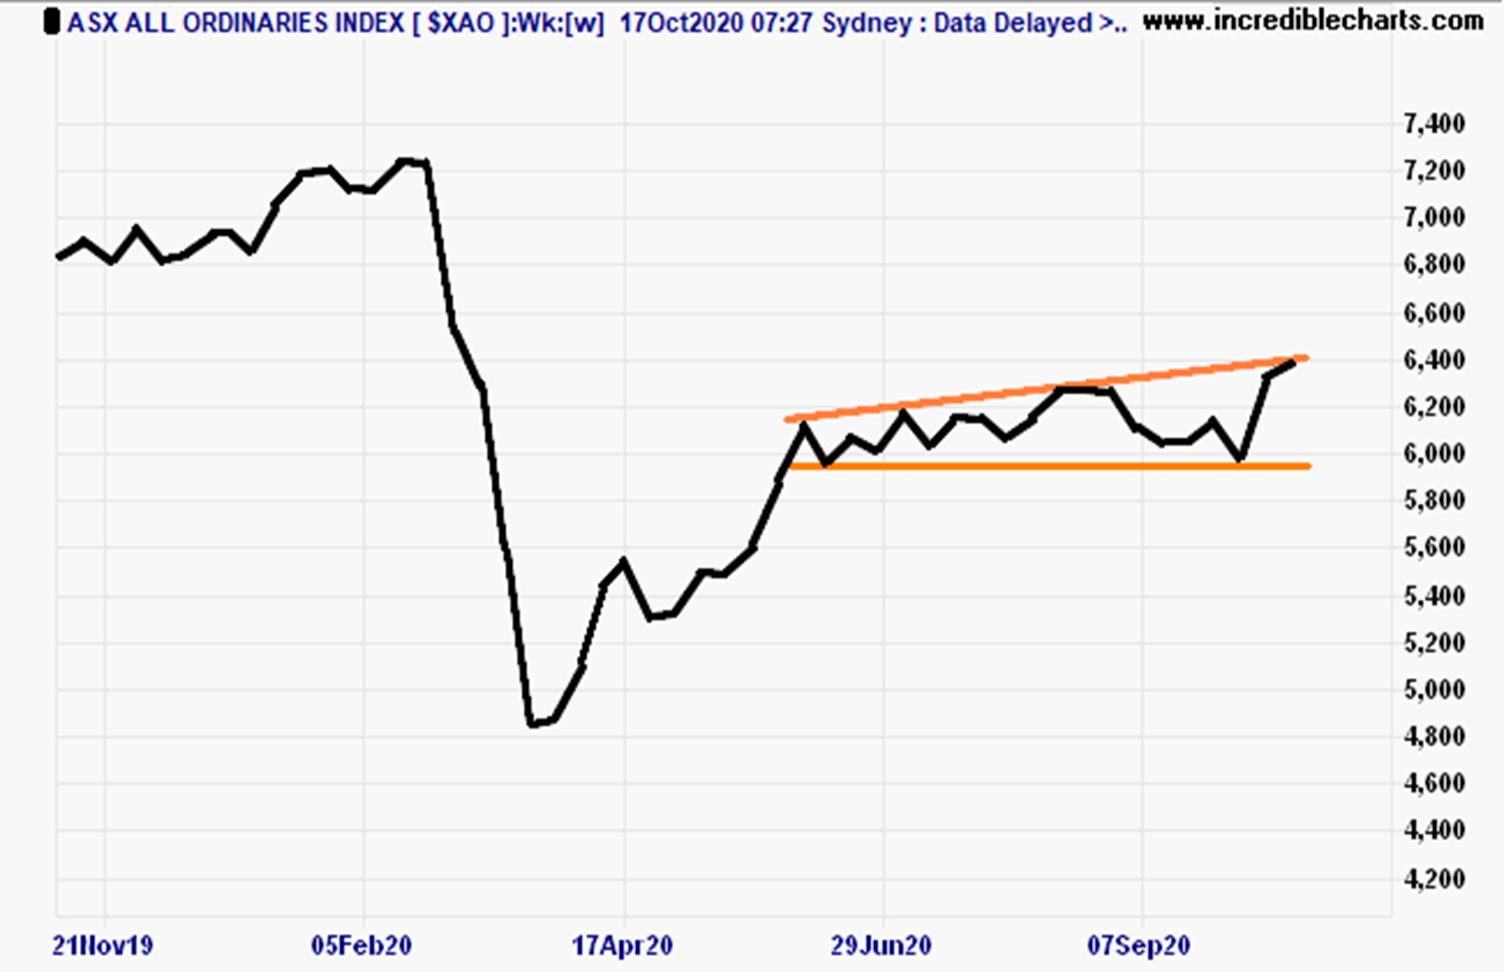
So what happens in the next week should indicate whether the stock market crash of 20 February to the 23 March is behind us.
Economic rebound
The seemingly skewed V-shaped recovery in the stock market reflects the economic consensus that the economy, after taking a steep dive in the March and June quarters, has rebound strongly in the September quarter and will continue its recovery in the current December quarter. That’s shown by the chart below for the USA.
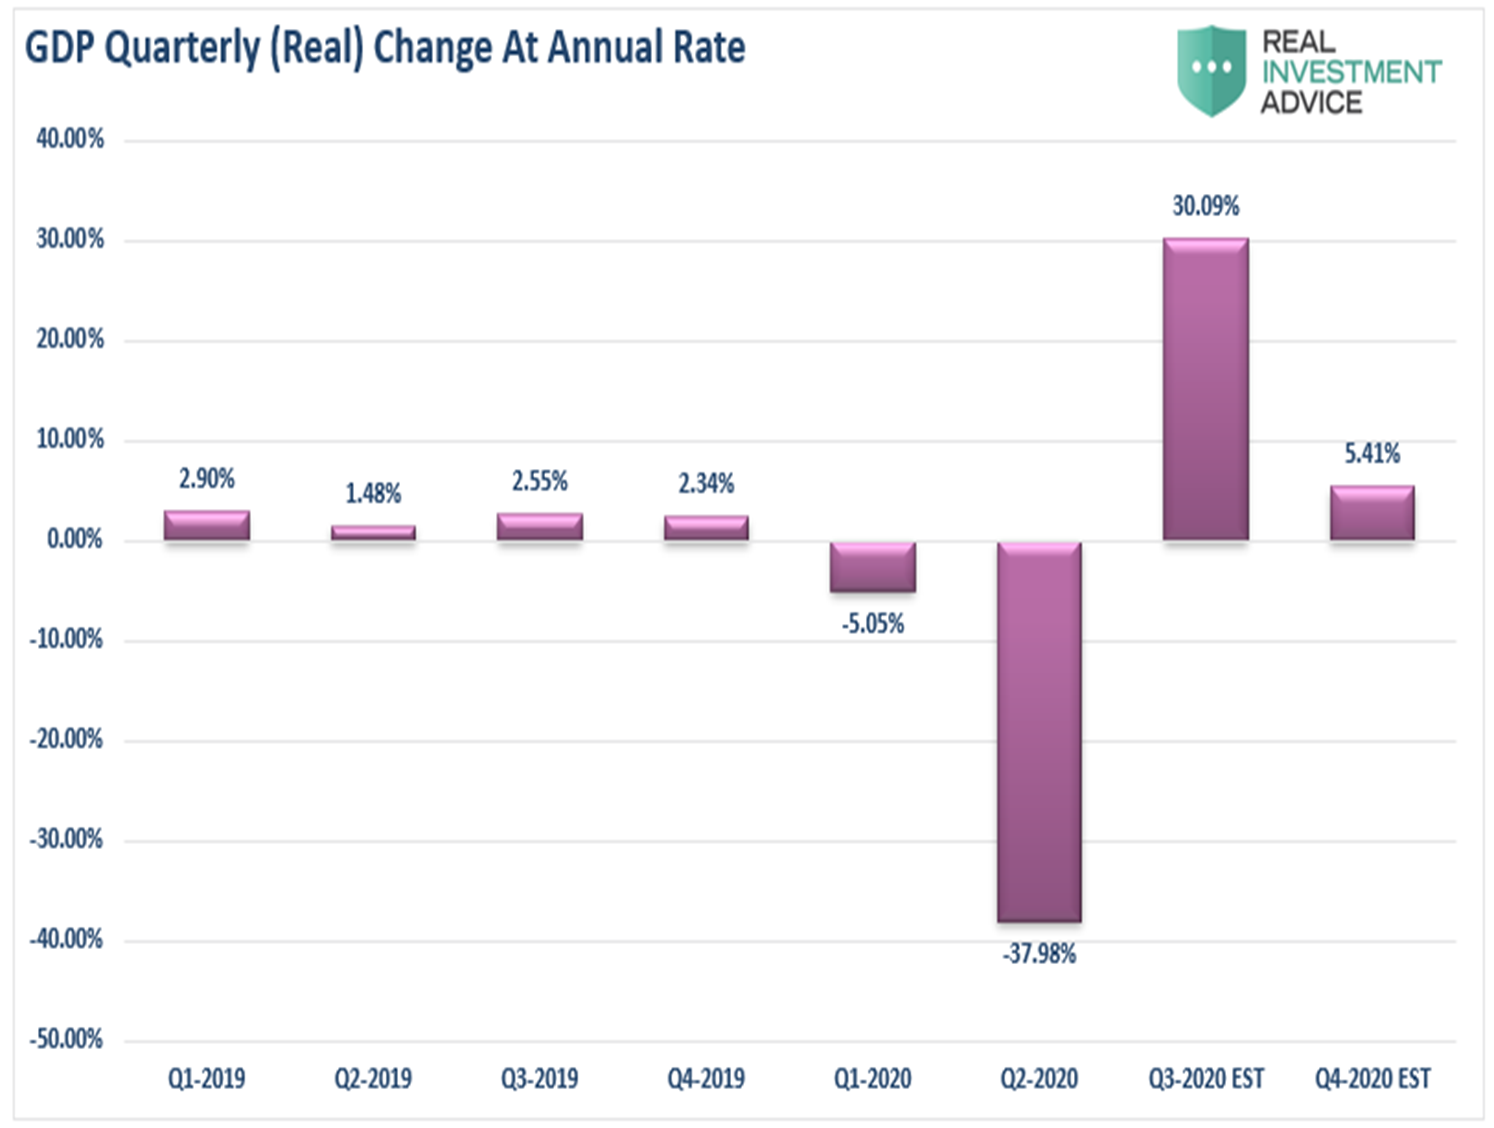
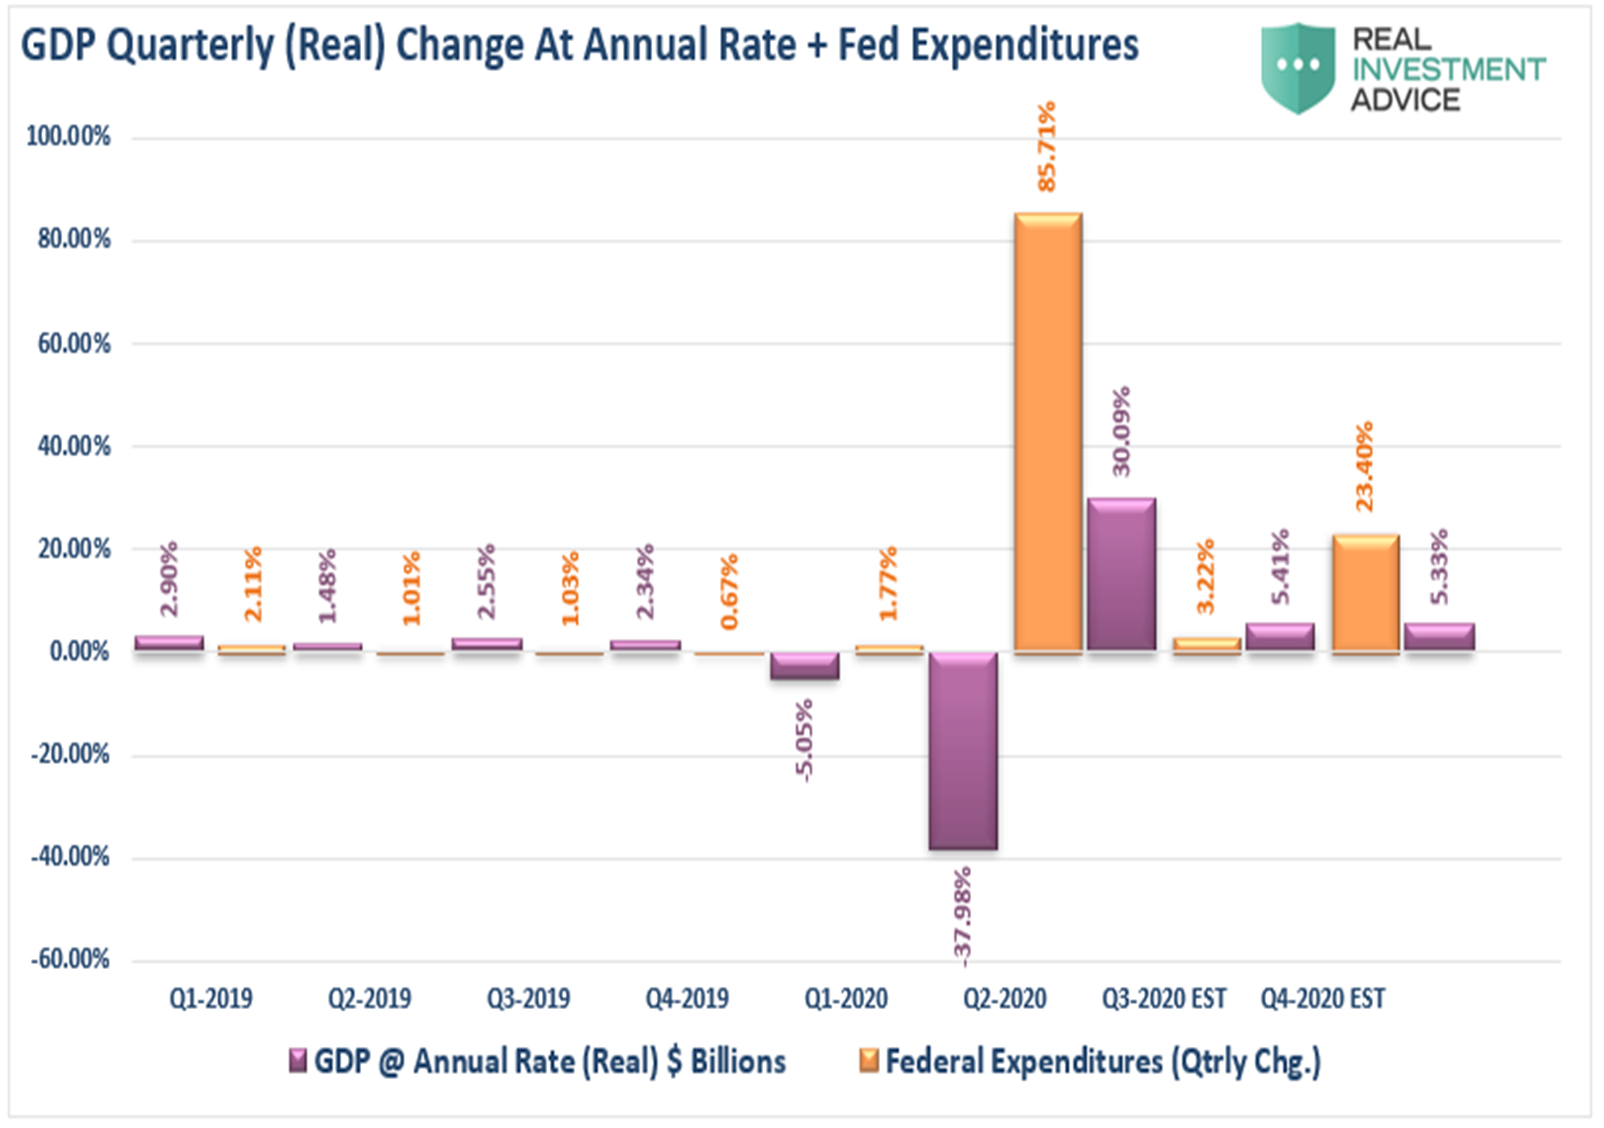
That expected 30% surge in the third quarter, and surging stock market to boot, directly responded to both the fiscal and monetary stimulus supplied. The chart below adds the percentage change in US federal government expenditures to the chart for comparison.
Lance Roberts of Real Investment Advice, however warns:
“At first glance, it appears that after one negative quarter of GDP, the economy is well back on track to normalcy. However, such an assumption would be incorrect. Given that we measure economic growth on an annualized basis, the three-quarters of positive change following such a steep decline still leaves the economy in a recession.
“Yes, add a couple of more quarters of economic growth, and you will eventually be back into positive territory. However, therein lies an even bigger problem.”
Debt Trap
Roberts then does some complex economic analysis before he concludes:
“… it will require more dollars to generate economic growth in the future. As shown, it will require $8.80 of debt-supported expenditures to create $1 of economic growth.
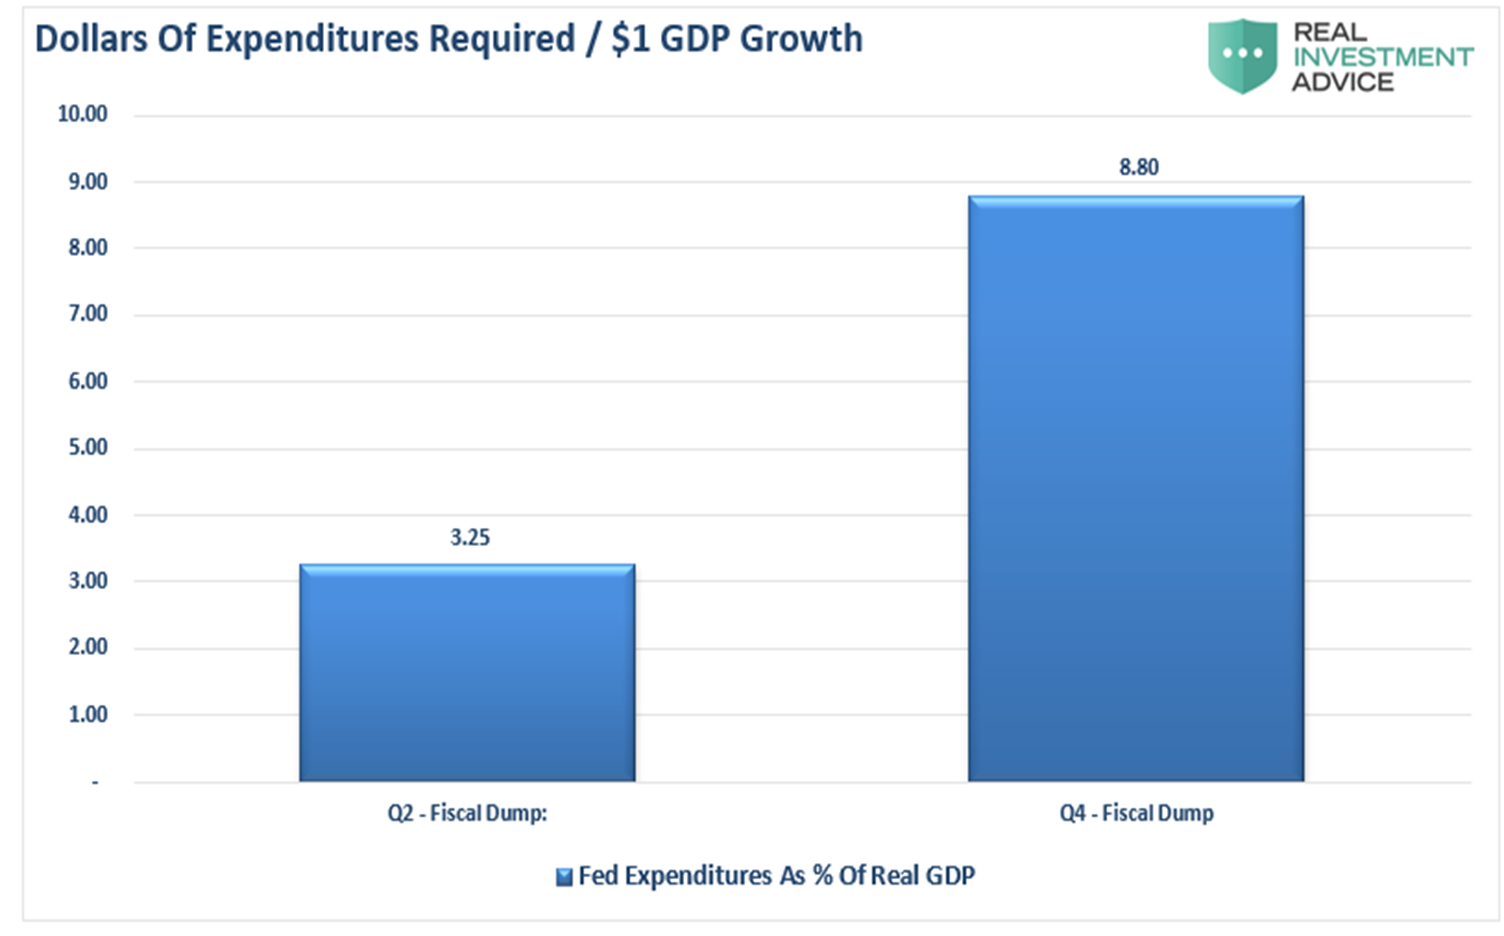
Here is what Roberts says in the rest of his article:
“As noted above, more debt doesn’t lead to stronger rates of economic growth or prosperity. Since 1980, the overall increase in debt has surged to levels that currently usurp the entirety of economic growth. With economic growth rates now at the lowest levels on record, the change in debt continues to divert more tax dollars away from productive investments into the service of debt and social welfare.
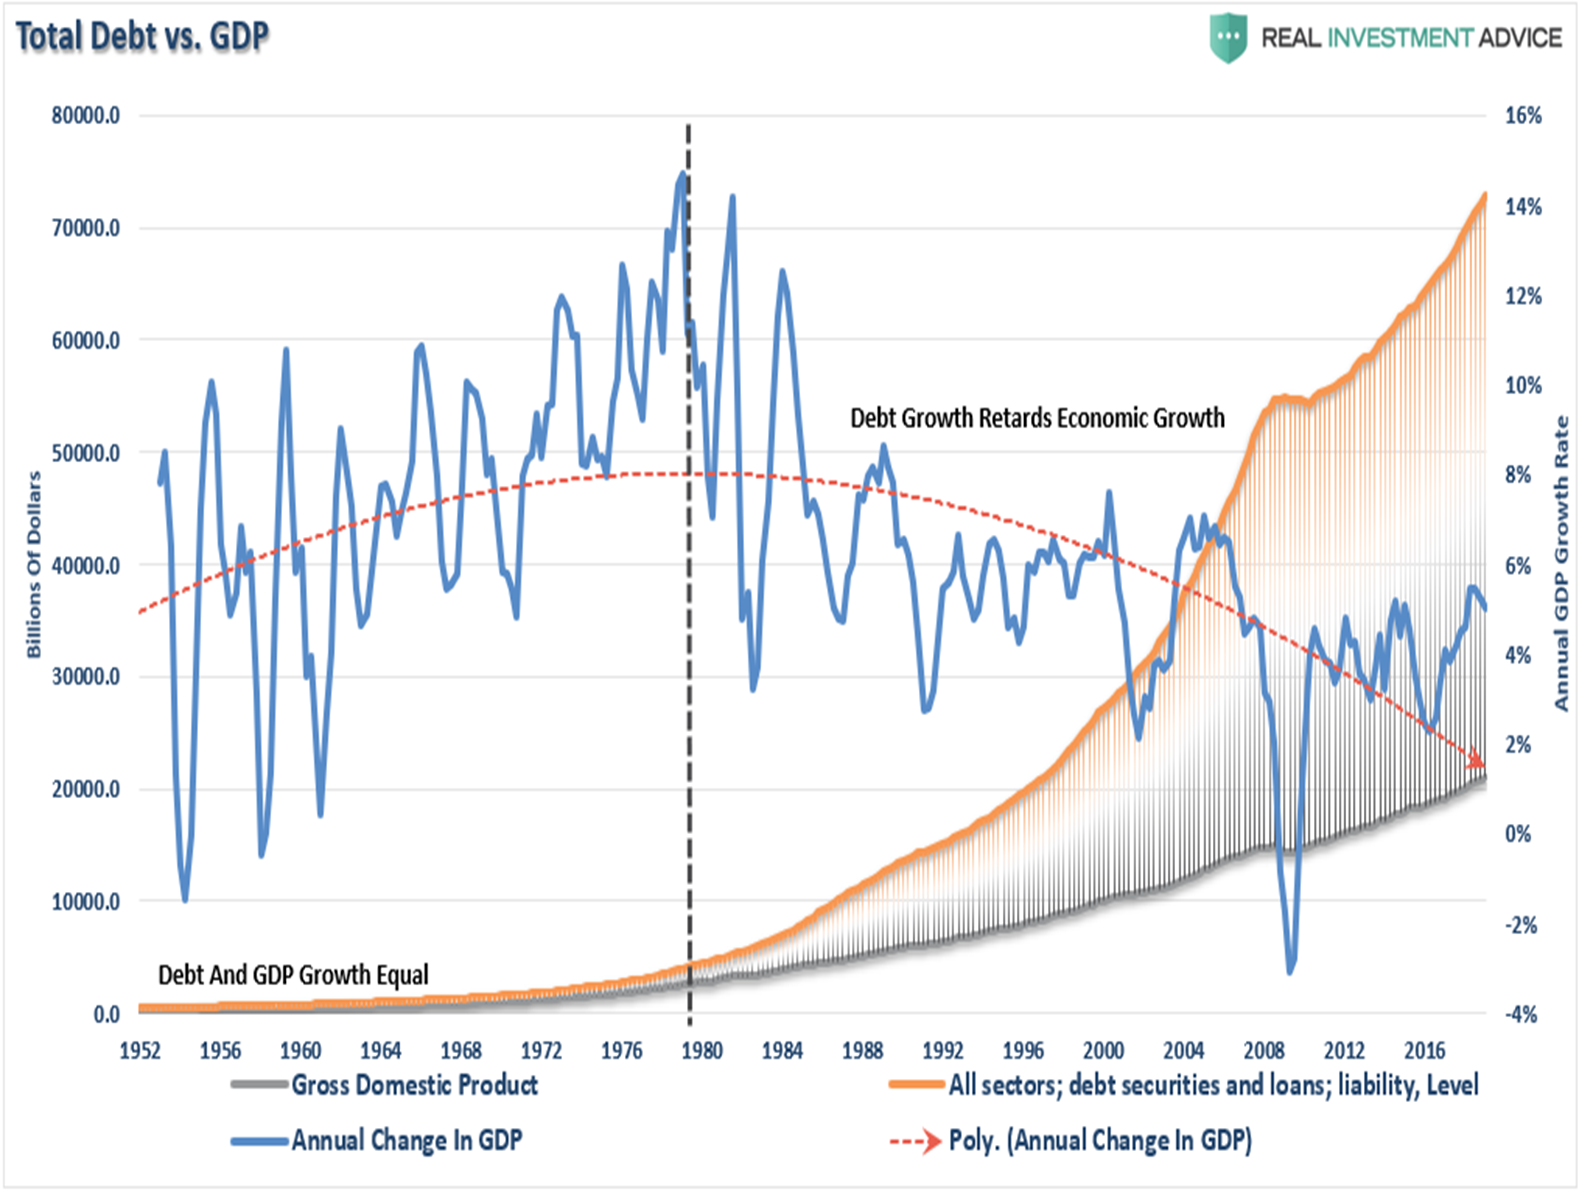
“Another way to view the impact of debt on the economy is to look at what “debt-free” economic growth would be. In other words, without debt, there has actually been no organic economic growth.
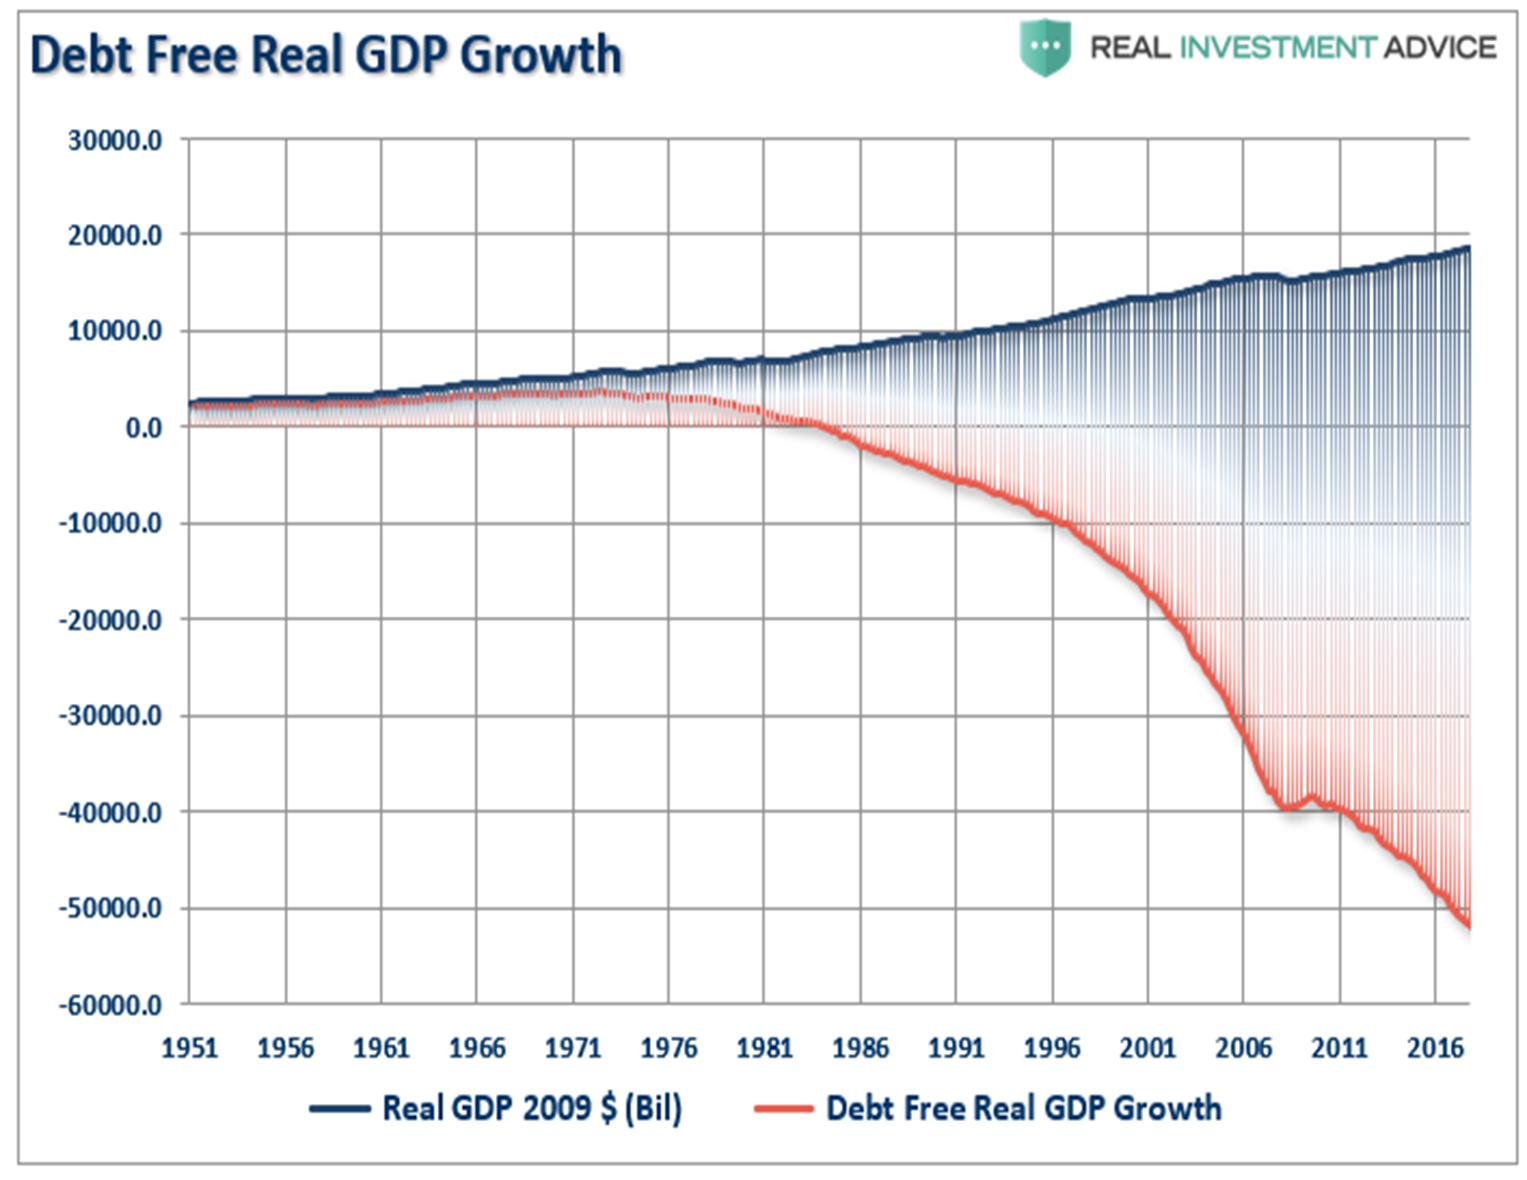
“The economic deficit has never been greater. For the 30 years from 1952 to 1982, the economic surplus fostered a rising economic growth rate, which averaged roughly 8% during that period. Such is why the Federal Reserve has found itself in a “liquidity trap.” [1]
“Interest rates MUST remain low, and debt MUST grow faster than the economy, just to keep the economy from stalling out.
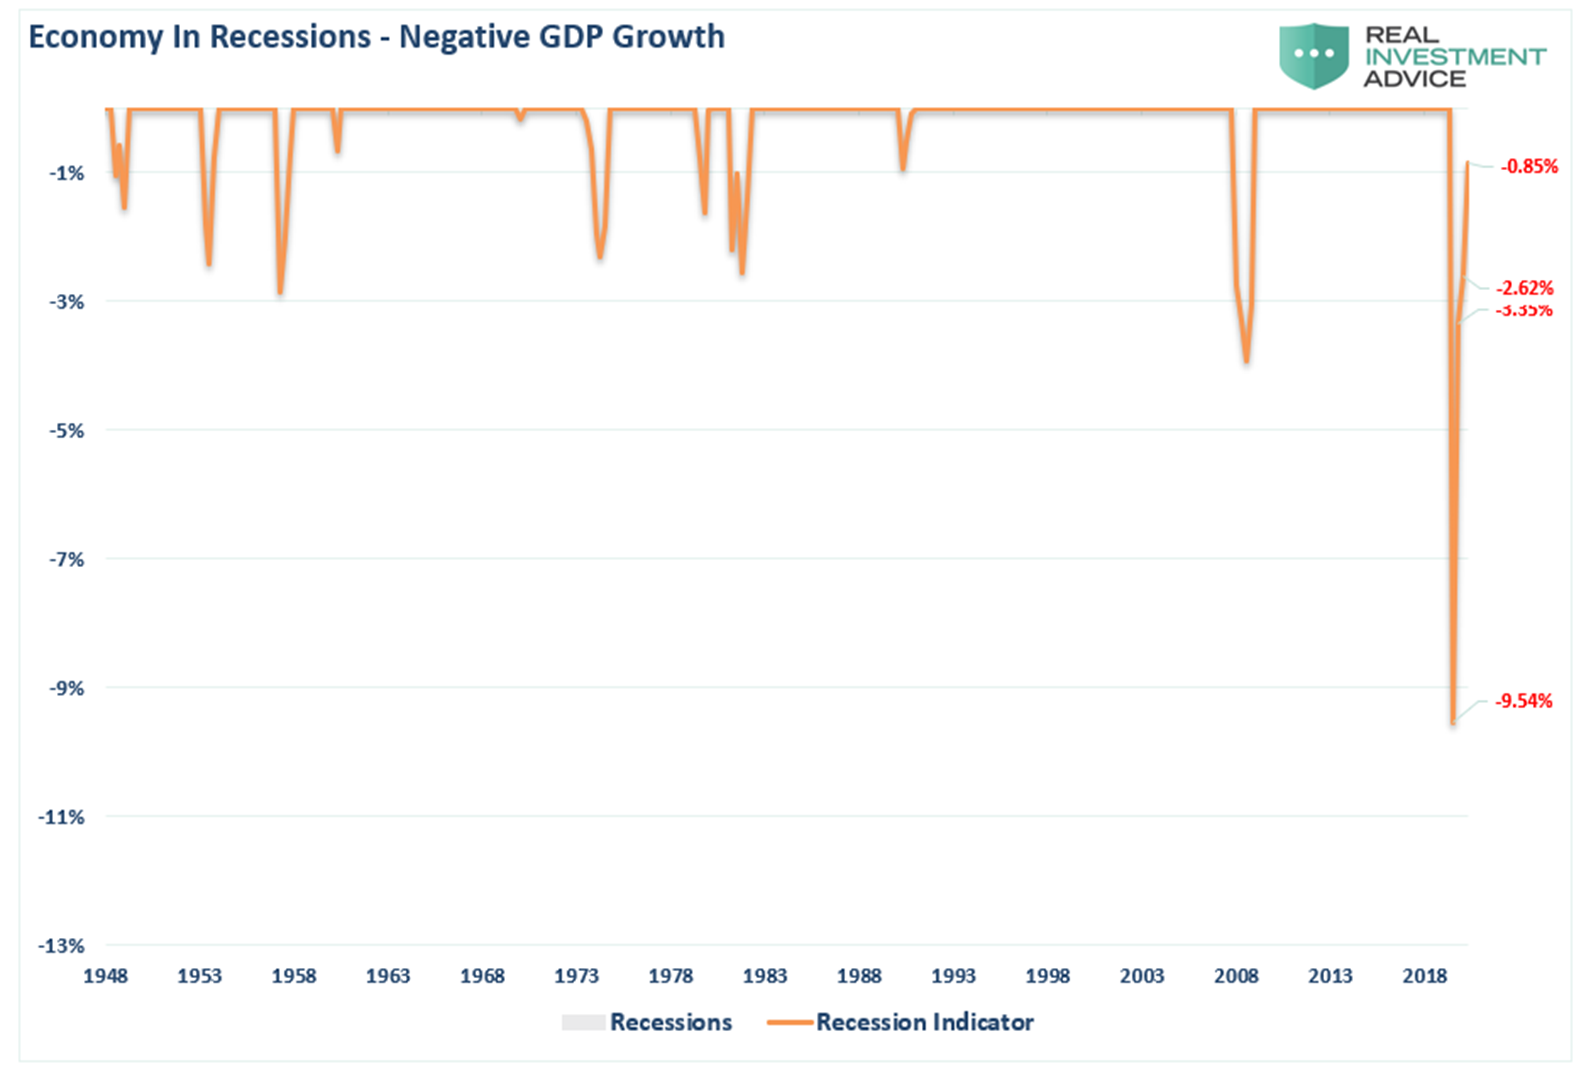
The deterioration of economic growth is seen more clearly in the chart below.
“From 1947 to 2008, the U.S. economy had real, inflation-adjusted economic growth than had a linear growth trend of 3.2%.
“However, following the 2008 recession, the growth rate dropped to the exponential growth trend of roughly 2.2%. Unfortunately, instead of reducing outstanding debt problems, the Federal Reserve provided policies that fostered even greater levels of unproductive debt and leverage.
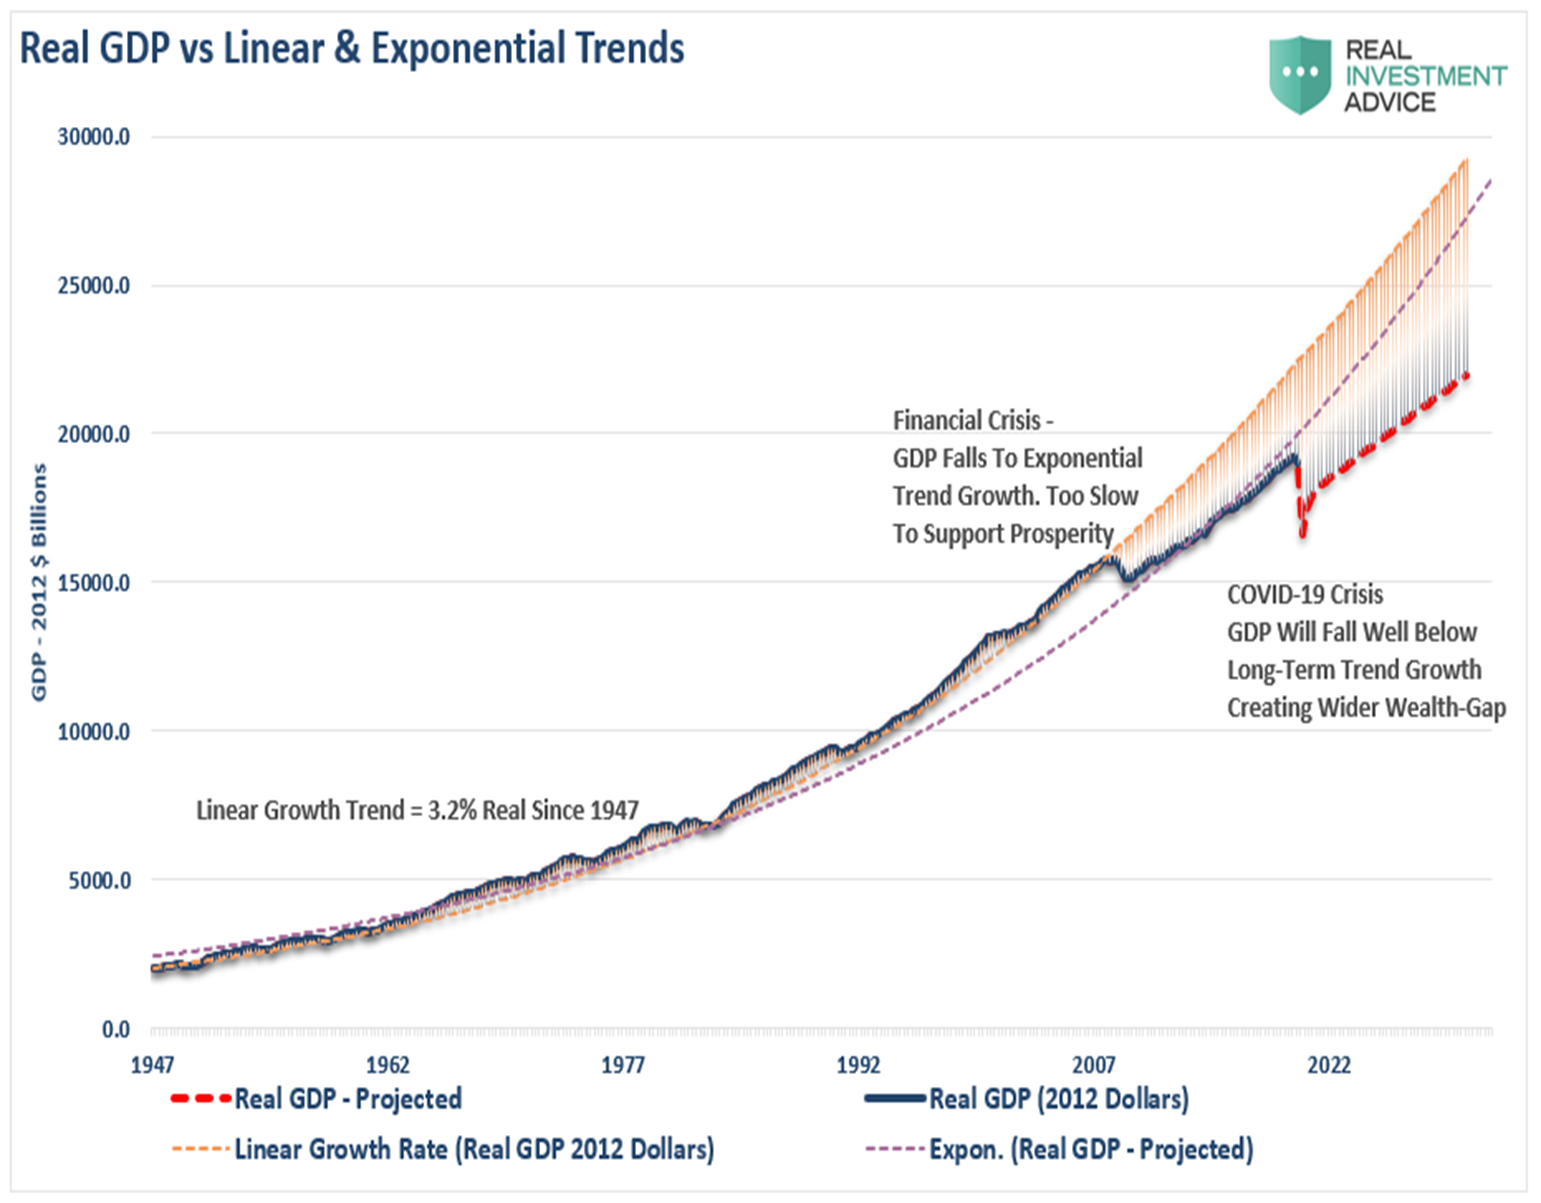
“Coming out of the 2020 recession, the economic trend of growth will be somewhere between 1.5% and 1.75%. Given the amount of debt added to the overall system, the ongoing debt service will continue to retard economic growth.”
If Roberts is right then both governments and central banks will continue to run up debt and money supply to stoke economic growth, but like a drug it will have less and less impact.
Inflation Risk
At some point the debt will need to reduce as a share of GDP. The easiest way for that to happen is an acceleration in price inflation because, except for inflation-linked bonds, the face value of a debt security loses buying power (real value) as consumer prices rise.
So, while the present economic consensus is for low inflation and low interest rates for at least the next three years beyond then the outlook could change dramatically if the huge fiscal and monetary stimulus being undertaken this calendar year in the USA, Australia and elsewhere does not jump start the global economy (GDP) back to normal real growth rates.
That’s because if large public deficits and money printing are maintained indefinitely to avoid recession then at some point it could trigger inflation if output does not respond. That would be devasting not only for bond markets, but also share markets. Here’s why:
“…stagflation is worse than a recession. It’s because stagflation combines the bad economic effects of a recession (stock declines, unemployment increases, housing market dips) with inflated prices.”
(Source: https://financhill.com/blog/investing/what-assets-do-well-during-stagflation [2])
Infinity pricing
However, in the meantime it’s possible that share markets will keep roaring ahead. The reason for that is given by Miles Staude, Director and Portfolio Manager, Staude Capital Limited. Here is his explanation in full:
“The big debate in finance today is whether investment markets have detached themselves from economic reality, or whether, in fact, they correctly reflect a new reality – one of unprecedented levels of government support, and a near zero interest rate world with no end in sight.
“The primary driver for increasing asset prices during the final years of the recent bull-market was not stellar economic growth, or companies greatly growing their underlying profitability. Rather, investors became willing to pay substantially higher valuations for the same financial assets. The driver for this investor largess was falling interest rates…
“Looking at the dramatic re-bound in asset prices since the Covid-19 crisis struck, one thing is clearly apparent again: markets are not rallying because companies are growing earnings, or because the economy has stepped it up a gear. In fact, once again, it is the complete opposite of this. An incredibly bleak economic outlook has forced interest rates yet lower still. “
Today, the yield on a 30-year US government inflation-protected bond is -0.5%. That is, the real interest rate you receive for lending money to the US government today, for a period of thirty years, is negative. It is a truism that lower interest rates justify higher financial asset valuations. Taken to its extreme, if you assume that interest rates are zero in any financial model, the calculated valuation you will receive is infinity.
‘For many investors these concepts start to look like financial alchemy, a view that is hard not to have sympathy for. And while we may still be someway yet from quoting stock prices in terms of ‘∞’, the challenge investors face today is that broad market returns are poised to be hyper-sensitive to the future direction of interest rates for the foreseeable future.”
If Miles Staude is right the bull market won’t end until interest rates lift themselves off the floor. And central banks don’t see that happening for many years to come.
Conclusion
No one knows what the future holds. All one can say is at present the Australian share market is bullish on short-to-medium-term trend analysis and on the point of becoming so too on medium-to-long-term analysis.
Important: This content has been prepared without taking account of the objectives, financial situation or needs of any particular individual. It does not constitute formal advice. Consider the appropriateness of the information in regard to your circumstances.