Last week this column looked at how Macquarie Bank (MQG) shares took a hammering in March due to investor concerns around stability and risks in the financial sector. Michael (Gable) says the same selling pressure had also hit CBA. But as with MQG, with those risks now dissipating, Michael says it’s worth looking at CBA’s share price chart to determine if these are good levels to buy.
“There are a few reasons to believe that there appears to be a solid low in place now for CBA and that it should head higher from here,” Michael said.
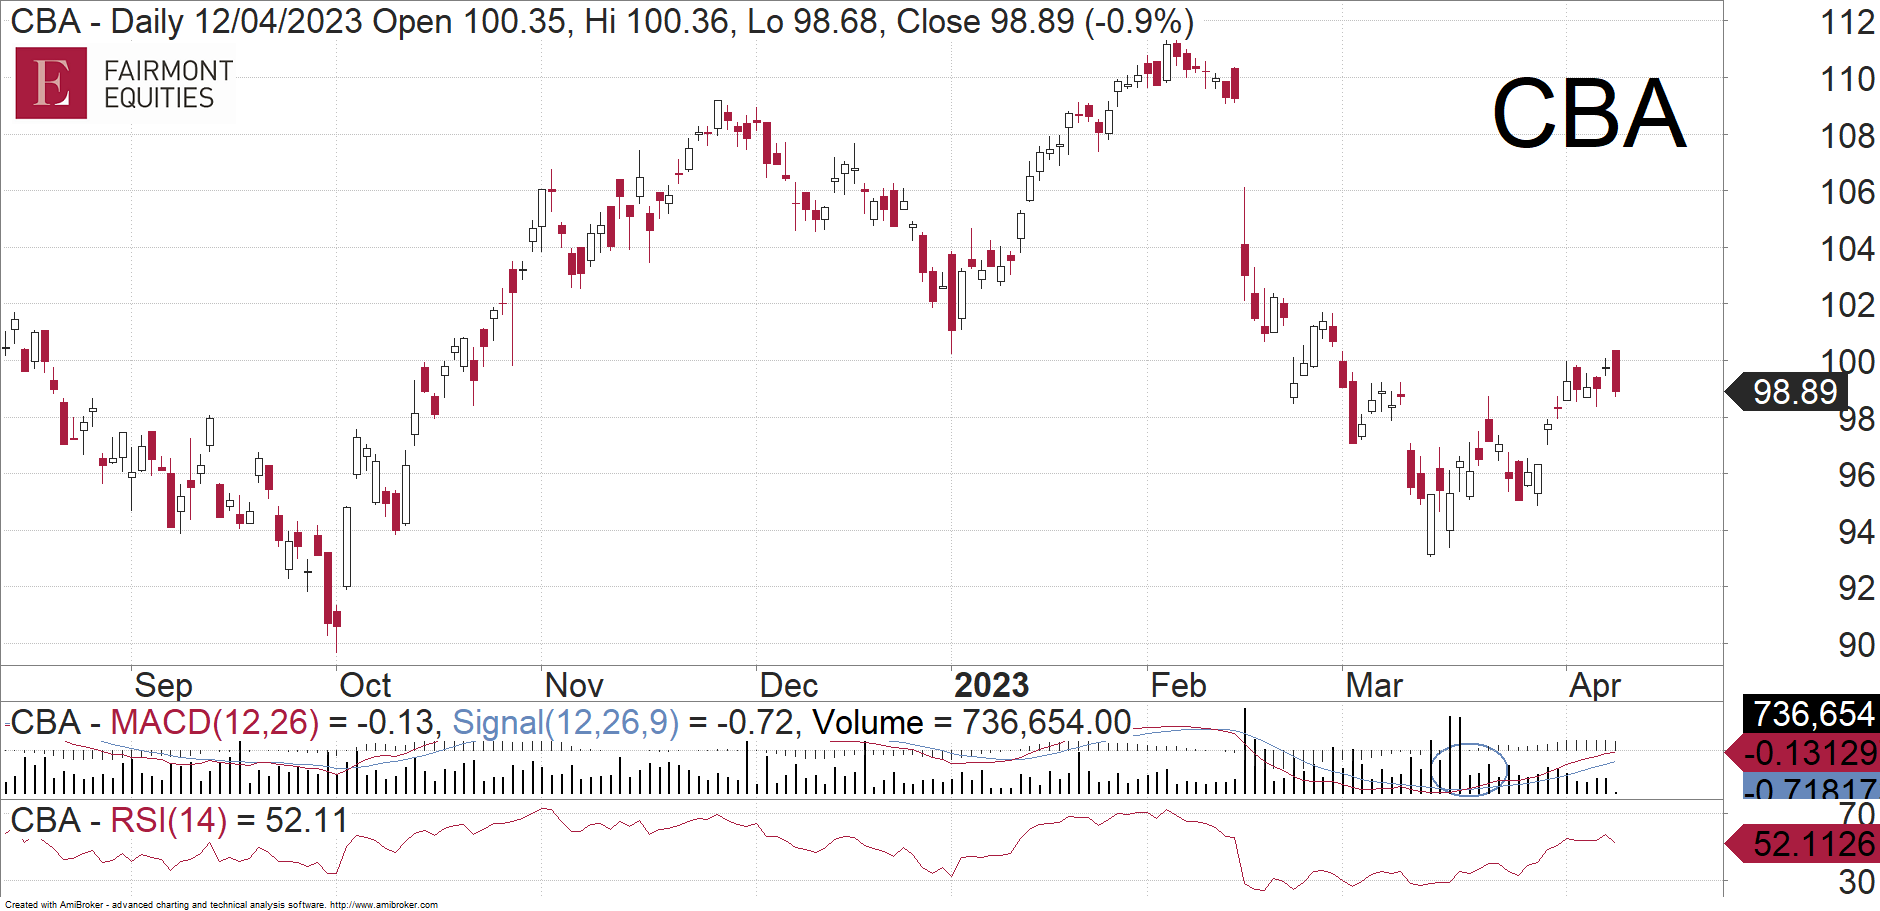
“Firstly, we can see in mid-March, a series of positive candles to show good buying support with increasing volume on the way up.
“This is indicated by the white candles where the share price of CBA was closing the day higher than where it opened.
“We can also see some bullish divergence on the Relative Strength Index (RSI).
“This is because it has been trending higher since late February, despite the share price heading lower.
“We have also had a buy signal on the Moving Average Convergence Divergence (MACD) that is circled on the chart.
“At the moment, CBA is consolidating around $100, as it prepares for the next move higher.
“All this price action is very positive and it suggests that CBA should soon trade higher from here,” Michael said.
Important: This content has been prepared without taking account of the objectives, financial situation or needs of any particular individual. It does not constitute formal advice. Consider the appropriateness of the information in regards to your circumstances.