I feel like a bit of a “broken record” when it comes to listed investment companies (LICs) premiums and discounts.
I have never understood why an investor would pay $1.20 for something that is worth $1.00. This is what happens when investors choose to invest in listed investment companies trading at a premium to their NTA (net tangible asset value).
Conversely, I don’t understand why investors sell an asset for just 80c when it is really worth $1.00. This occurs when LICs trade on the ASX at a discount to their NTA.
Last June, I nominated three major listed investment companies to sell, with the proceeds potentially re-invested in ETFs (see https://switzerreport.com.au/3-listed-investment-companies-to-sell/ [1] )
At the time, the ASX 200 was near its lows at 6,578.7. On Friday it closes almost 900 points higher at 7,434,or in percentage terms, up 13.0%. Here is what has happened to the LICs I nominated:
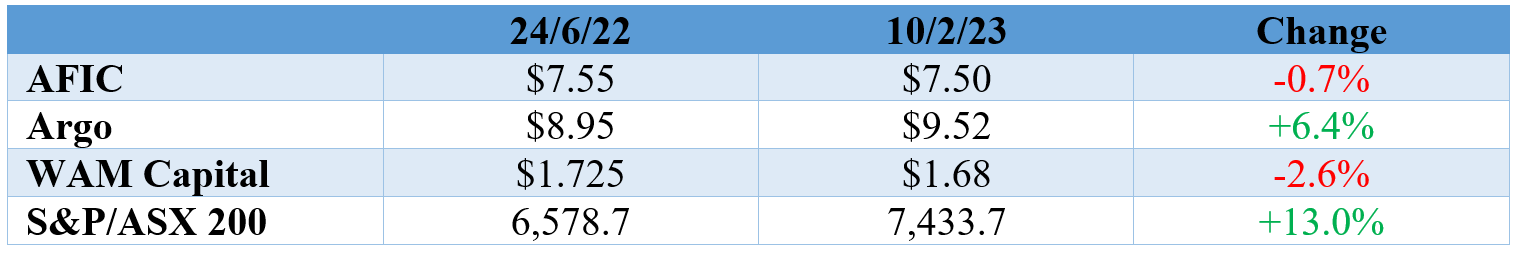
In addition to underperforming, the premium to NTA has narrowed over this period. But they are still trading at a premium, and today, remain a ‘sell’.
Here is a review of these listed investment companies and the “replacement trade” – what to buy to retain a similar market exposure.
1. Australian Foundation Investment Company (AFI)
Australian Foundation Investment Company (AFIC or AFI, the latter is the ASX ticker code) is Australia’s biggest LIC at around $9.1bn. Its investment objective is to provide shareholders with attractive investment returns through access to a growing stream of fully franked dividends and enhancement of capital invested over the medium term.
AFIC’s portfolio reads like a “top 50” list of companies – Commonwealth Bank, BHP, CSL, Macquarie, Transurban, Westpac, Wesfarmers and NAB are the largest holdings – but there are biases. On a sector basis, it is overweight healthcare and industrials, marginally overweight financials, and underweight materials and real estate. It has a notable holding in Mainfreight (NZE: MFT).
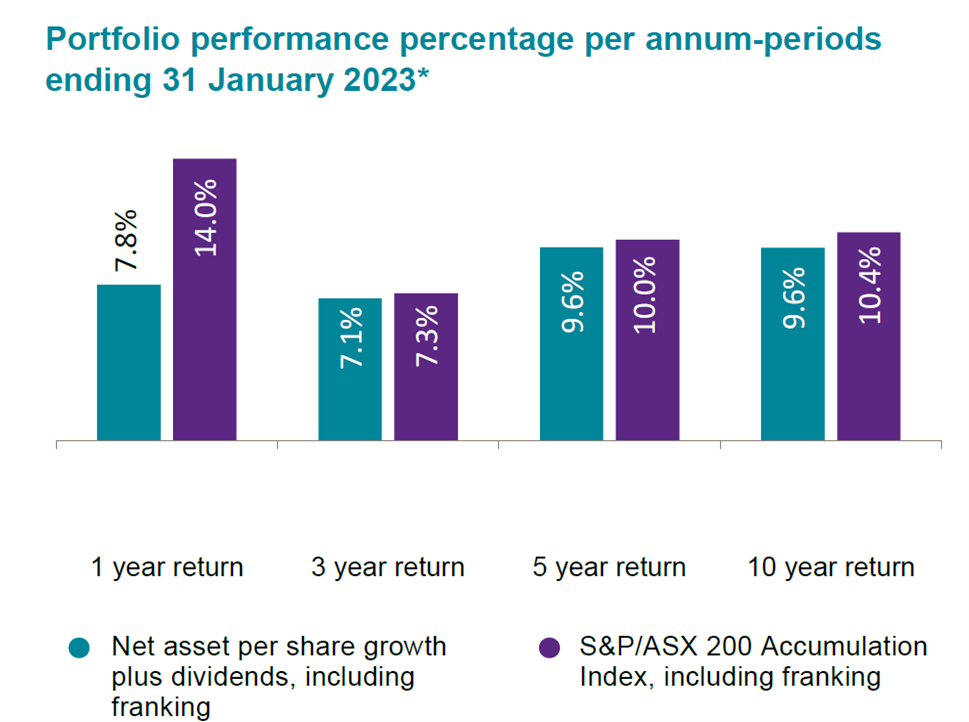
It benchmarks against the S&P/ASX 200 Accumulation index, but measures performance against the franking adjusted index, which adds about 1.5% to the overall return. Over 1 year, 3 years, 5 years and 10 years, it has marginally underperformed compared to the index. For 10 years, a return of 9.6% pa compared to the index return of 10.4%. In the 12 months to end January, it returned 7.8% compared to the index return of 14.0% (an underperformance of 6.2%).
Interestingly, its dividend yield is not that attractive. On a forecast dividend of 27c for FY23 and Friday’s closing share price of $7.50, it is yielding 3.6%.
AFIC’s management fee of 0.16% pa (and no performance fees) is one of the lowest for an actively managed portfolio.
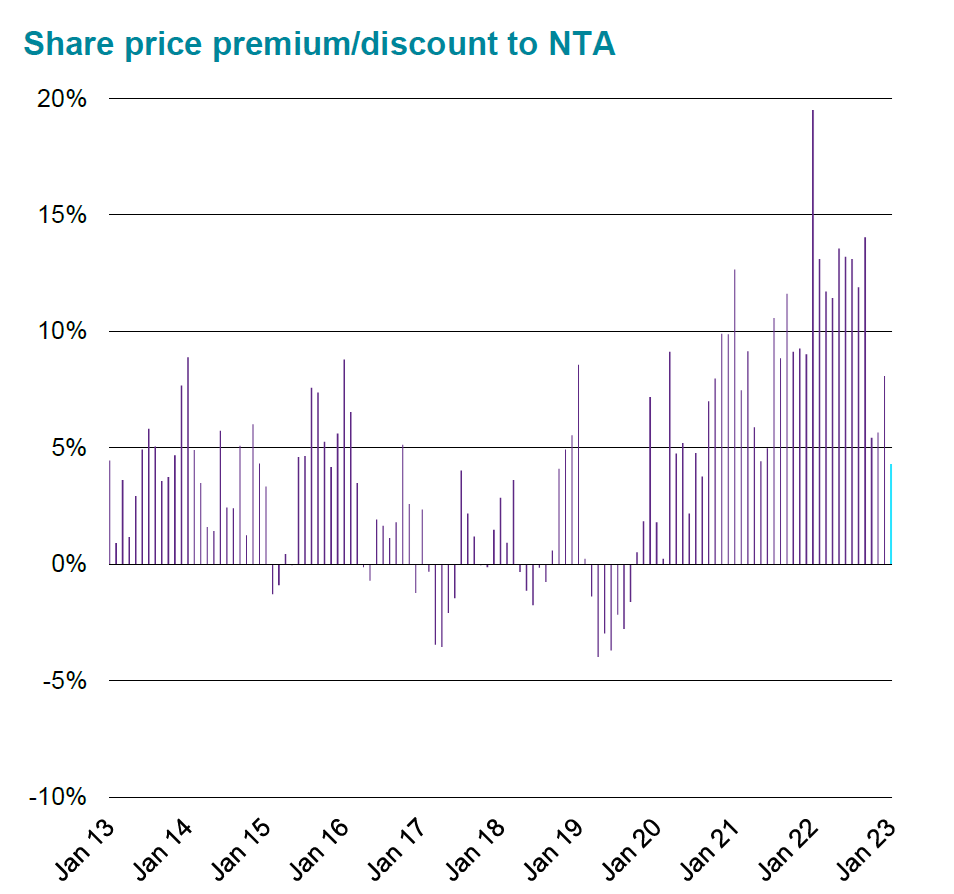
At the end of January, it was trading at a premium of 4.3% to NTA. This is down considerably from the premium last June when it was nearer 15%. The chart below shows the premium/discount of the share price to the NTA over the long term.
2. Argo Investments Limited (ARG)
Argo (ARG) is similar in style to AFIC, but not quite as big at $7.1bn. It also boasts an incredibly low management fee of 0.16% pa.
Its objective is to maximise long term shareholder returns through reliable fully franked dividend income and capital growth. It has a well-diversified portfolio, with the ‘top 10’ in descending order being Macquarie, BHP, CSL, CBA, Rio, Wesfarmers, ANZ, Westpac, Telstra and NAB.
The company benchmarks against the S&P/ASX 200 Accumulation Index. Similar to AFIC, it moderately underperforms compared to the index over all time periods.
With a forecast full year dividend of 34c for FY23 (Argo paid out 33c for FY221), it is trading on a yield in the range of 3.8%..
Argo typically trades at a smaller premium than AFIC. At 31 January, based on a share price of $9.42 and NTA of $9.21, it was 2.3%. On Friday, with a closing share price of $9.52, I estimate it had increased to around 4.0%.
3. WAM Capital (WAM)
Wilson Asset Management’s flagship LIC, the $1.7bn WAM Capital Limited (WAM), provides investors with exposure to an actively managed diversified portfolio of undervalued growth companies with a focus on small to medium sized businesses.
At the end of December, holdings included names such as EVT, Webjet, Estia Health, Pro Medicus and IDP Education. On a sector basis, overweight biases were in consumer discretionary and industrials, and underweight biases were in financials, materials, real estate and health care.
Since inception in August 1999, WAM’s investment performance has been 14.8% pa, before fees and expenses. This is 6.6% pa outperformance compared to the All Ordinaries Accumulation Index, and 9.7% pa outperformance compared to S&P/ASX Small Ordinaries Accumulation Index. If management fees were included (WAM is one of the very few LICs or managed funds that doesn’t include these fees), the performance would be lower, but still impressive.
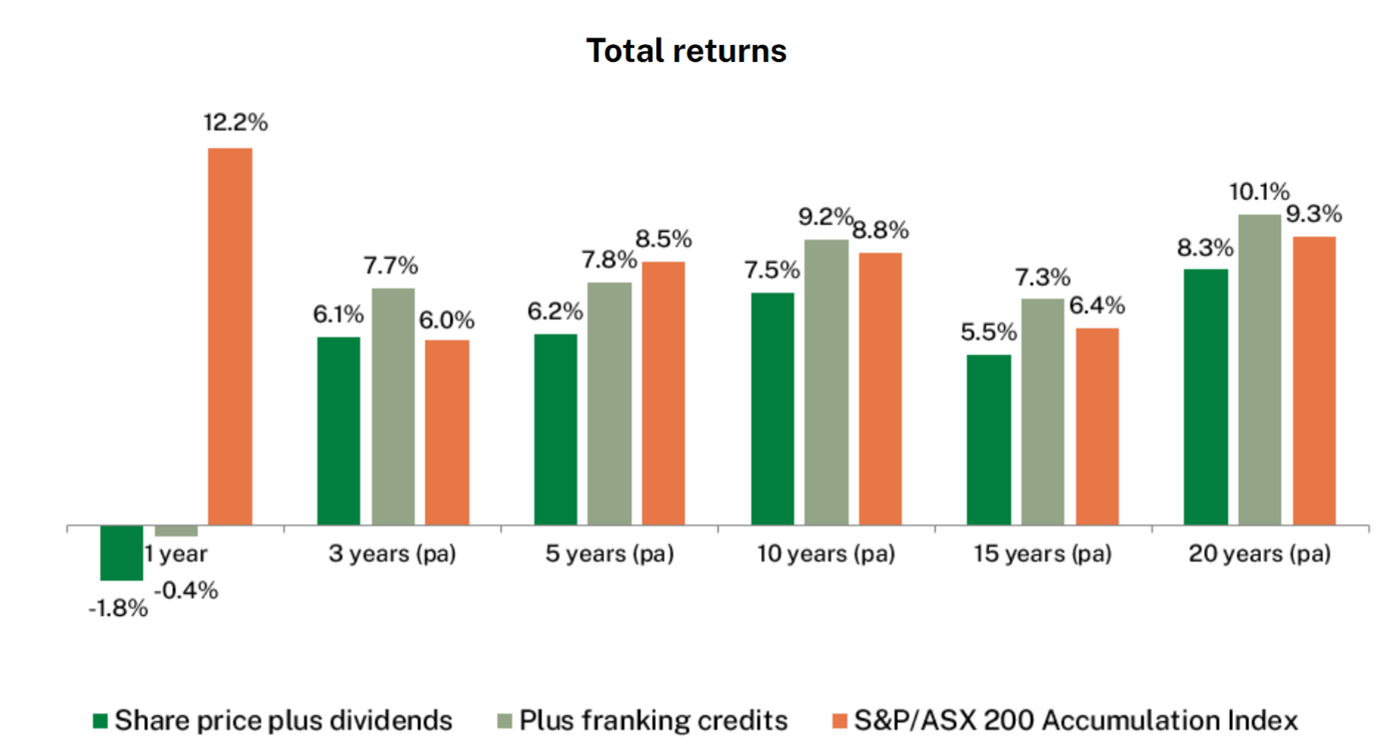
However, portfolio performance has waned recently. Over 1 year, 3 years and 5 years to 31 December, it has underperformed compared to the S&P/ASX All Ordinaries Accumulation Index, and very moderately outperformed compared to the S&P/ASX Small Ordinaries Index. Again if management fees were included, the relative performances would be worse.
At 31 January, WAM was trading at $1.55, placing it on a small premium of 4.8% to its estimated NTA of $1.48. The premium has fallen massively, having been over 25% at the end of May last year. This month, the premium has blown out again to approximately 15% as the shares have rallied on the back of news that Geoff Wilson had purchased shares in WAM. On Friday, the shares closed at $1.68.
One of the major attractions of investing in WAM is the prospect of a high fully franked dividend. On a forecast dividend of 15.5c for FY23, this puts WAM on a yield of 9.3%. But a note of caution for investors just buying for yield alone: one year ago, WAM’s share price was $2.21, today it is $1.68.
The replacement trades
The obvious trade for a holder of AFIC or Argo, which are clearly delivering broad share market performance (index), is to sell and invest in one of the index funds, either Vanguard’s Australian Shares Index Fund (VAS) which tracks the S&P/ASX 300 index, or iShares IOZ which tracks the S&P/ASX 200 index.
If you sell WAM, what to buy? This is more difficult because it operates in a niche of the market less well serviced by other ASX listed funds. My best guess is probably to look again at VAS or IOZ, or invest directly.
Important: This content has been prepared without taking account of the objectives, financial situation or needs of any particular individual. It does not constitute formal advice. Consider the appropriateness of the information in regards to your circumstances.