I am always amazed by investors who want to pay $110 for something that is worth $100. And that’s exactly what is occurring when they buy two of Australia’s largest and most respected listed investment companies – Australian Foundation Investment Company (ASX: AFI) and Argo Investments (ASX: ARG).
These companies own no assets other than paper assets – listed shares. They don’t have any real assets, intellectual property, trademarks, sales or annuity income. They have an in-house investment team with an investment track record – but that’s about it. Presumably, the investment team would be roughly the same size whether they managed $5bn or $20bn of investors’ monies.
At the end of February, AFI’s shares were changing hands on the ASX at $7.96. The net tangible asset value (NTA) – that’s the amount that you would get back as a shareholder if the company was liquidated and all the listed shares it owns were sold at market price and all the liabilities were paid off – was just $7.04. That means that AFI was trading at a premium of 13.1%. To put this in a monetary context, investors valued AFI’s $8.7bn portfolio of listed shares at almost $10bn!
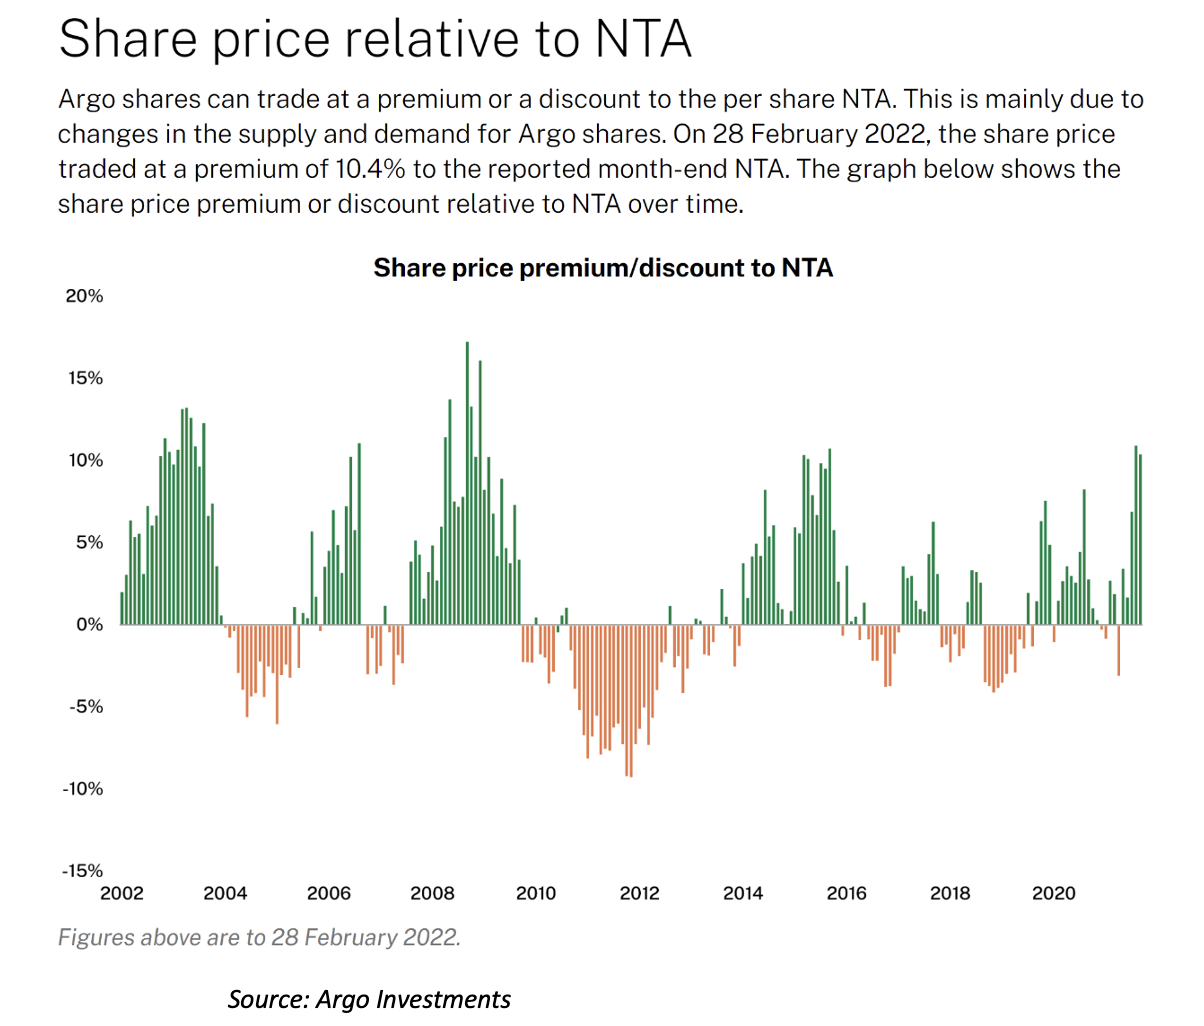
Argo Investments wasn’t quite as crazy as AFI – investors were only paying a premium of 10.4%.
Don’t get me wrong about AFI or Argo. Tens of thousands of investors have trusted them with their monies. They provide broad based exposure to the Australian stock market, are low cost, and look after their shareholders by providing fully franked dividends and access to share purchase plans. But the dividend yield is only adequate – AFI is about 3.0% and Argo 3.1%.
And performance is largely index, which isn’t surprising given their size, they are broad based and the concentration is of the Australian share market. In fact, it is a fraction below the index.
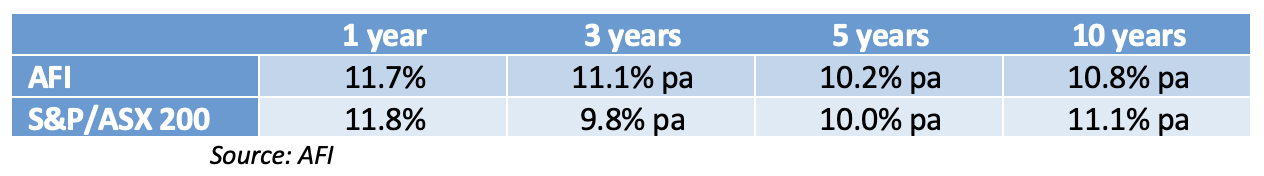
The table below lists AFI’s performance over periods out to 10 years. It benchmarks itself to the S&P/ASX 200 accumulation index, grossed up for the benefit of franking credits. While it has done better in recent years, over 10 years, it is behind by 0.3% pa.
Performance to 28/2/2022– AFI vs S&P/ASX 200 Accumulation including franking
Argo, which doesn’t include franking credits in its numbers, has outperformed over the last 12 months, but underperformed against the index over 3 years, 5 years and 10 years. Its 10-year return (which doesn’t include franking credits) is 8.8% pa, compared to the index’s 9.6% pa (the index also doesn’t include franking credits).
So, why don’t investors sell their holdings in AFI or Argo when they are trading at such a big premium? Perhaps more importantly, why do new investors pay $113 for an investment that is only worth $100?
Apart from inertia, I guess there are three reasons.
Firstly, investors are unaware of the premium or discount they are paying. This is a little surprising because both AFI and Argo do a good job of promoting this point on their websites. In fact, a close look at Argo’s chart (see below) of historic premiums/discounts shows that they are cyclical and the current premium is close to a record.
Second, capital gains tax issues could come into play. That’s a valid reason for current investors, but not potential investors.
And I guess that the third reason is that they don’t know what the alternatives are.
In fact, there are very good alternatives – they are called index funds. Vanguard’s Australian Shares Index Fund (ASX: VAS) which tracks the S&P/ASX 300 index, iShares IOZ or SPDR’s STW (which track the S&P/ASX 200 index) or BetaShares A200 (which tracks a similar index of 200 shares).
These funds are “guaranteed” to deliver a return of index minus a fraction – the fraction being their management fee – which is at best what the listed investment companies are earning over the long term. And their distributions, which includes franking, is about the same.
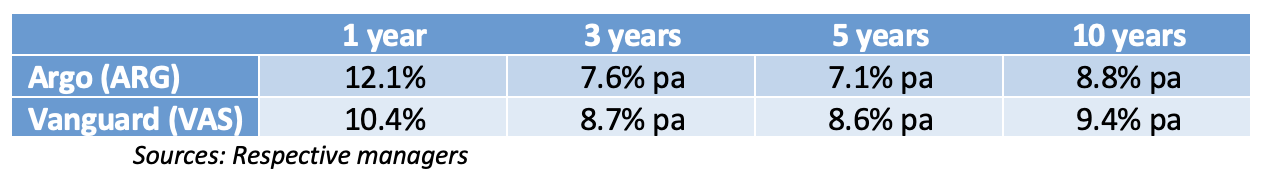
The table below compares the performance of Vanguard’s VAS with Argo. Except for the last 12 months when Argo obviously made some good investment calls, Vanguard’s VAS is beating it over all time periods (and that’s after fees). In fact, it is comprehensively beating it over 10 years.
Performance to 28/2/2022 – Argo (ARG) vs Vanguard Aust Shares Index ETF (VAS)
 Now I am not advocating that you shouldn’t own AFI or Argo. In fact, I think they are great investment options when trading at a discount or even a small premium. But when they are trading at a big premium, switching into an ETF will make sense over the long term.
To demonstrate, let’s compare the break-even of investing $100 in VAS to investing $100 in AFI. Let’s assume that it is trading at a 10% premium to NTA, so effectively, you are only buying $90.91 worth of share exposure.
If VAS can generate a return of 8% pa over 10 years, then assuming distributions are re-invested, it will be worth $215.89. The equivalent return required by AFI would be 9.03% pa.
An outperformance of 1.0% pa for 10 years by AFI over VAS, though possible, is very, very unlikely.
Sell AFI and Argo.
Important: This content has been prepared without taking account of the objectives, financial situation or needs of any particular individual. It does not constitute formal advice. Consider the appropriateness of the information in regards to your circumstances.