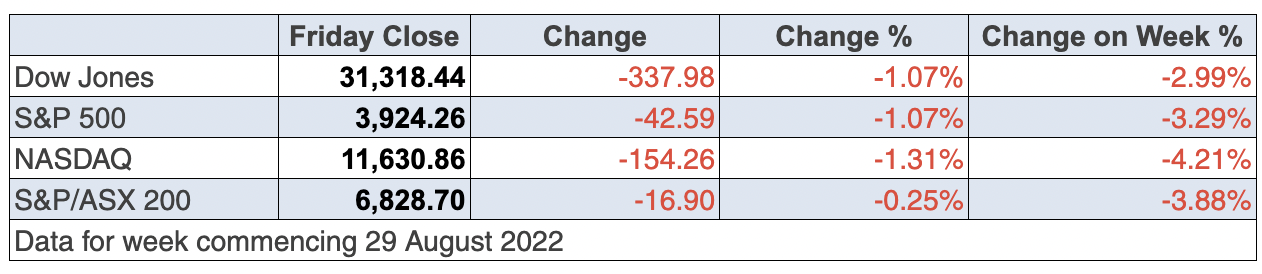
The US August jobs report came in on expectations, with 315,000 jobs created and unemployment rising from 3.5% to 3.7%, increasing the likelihood that the Fed’s rate rising program could come up with a soft landing for the US economy. European markets saw the figures and spiked, with the German Dax up 3.3% and the UK’s FTSE rising 1.86%. And yep, Wall Street followed suit, until it didn’t, despite a good reaction from expert commentators.
“Not too hot. Not too cold. It’s right around expectations,” said Steve Sosnick, chief strategist at Interactive Brokers — A Goldilocks report. “There’s nothing in here that takes 75 [basis points] off the table,” he said. “A number that is within expectations doesn’t change anything. What we’re seeing now is a relief rally.” (CNBC)
A really low number would have been good for inflation worriers but it might have given recession panic-merchants more reason to sell stocks before it’s too late. The Dow, the S&P500 and the Nasdaq spiked nicely on the number, but no one thought it was good enough to make the Fed give up on its intention to raise the official rate by another 0.75% at the September 20-21 meeting of the Federal Open Market Committee (FOMC).
Federal funds futures traders have priced in a 70% chance of a 75-basis points interest rate hike at the Fed’s next policy meeting on September 20. And as the US trading day progressed, the combined fears of inflation and recession worriers took market indexes down.
The only possible changer of the central bank’s mind would be a big fall in inflation on September 13, but that’s not likely if we can believe economists’ best guessing right now. However, if it’s a nicely lower number from July’s 8.5%, then speculation that the Fed will reduce the next rise or even try a pause could excite stock players.
Remember my call has always been that stock prices will start to recover in October and roll into a solid December quarter and 2023. This depends on lower inflation showing up. Hopefully, lower inflation (because of the success of the rate-rising program of the Fed) will meet lower costs from no lockdowns in China (though news from Chengdu where 21 million have re-entered lockdown this week is annoying). Also, lower inflation could be helped by reductions in the bottlenecks in the supply chain that have come out of the pandemic problems for manufacturing and transport globally.
The really big boost for stocks in 2023 would be an end to the Russian war, but who can really expect anything rational when it comes to Putin?
Central banks must bring inflation down, but they also have to avoid a recession. This jobs report says “so far so good” for Fed boss Jerome Powell.
A good news number from the September CPI might help the stock market, which, incidentally, has often been a bad month for stock prices.
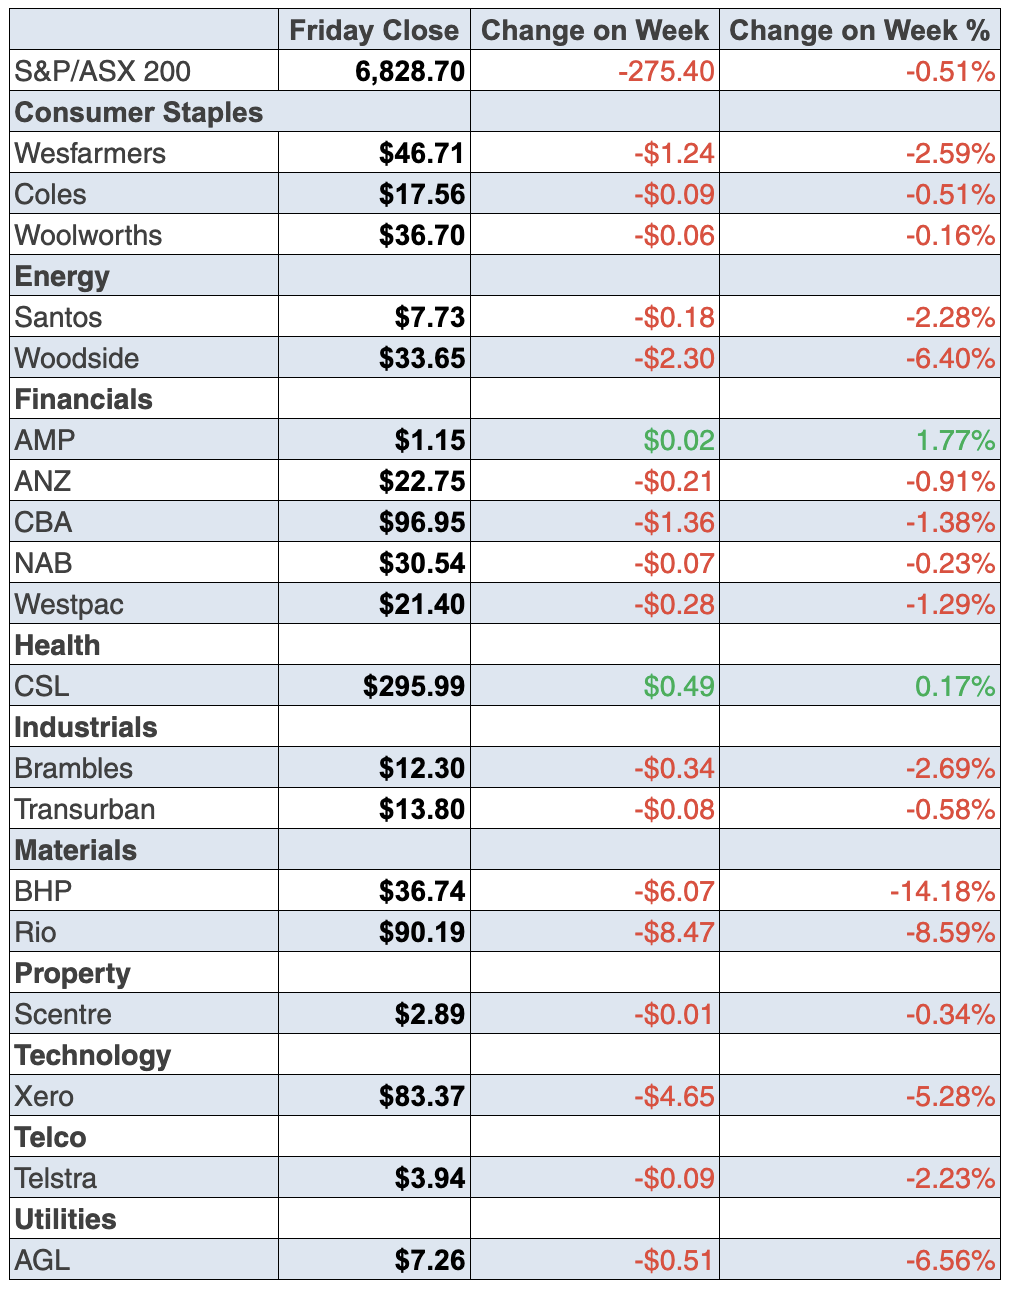
To the local story and the week was a shocker, with the S&P/ASX 200 down 275 points (or 3.9%) for the week, ahead of the US jobs report, which, as I’ve said, turned out OK.
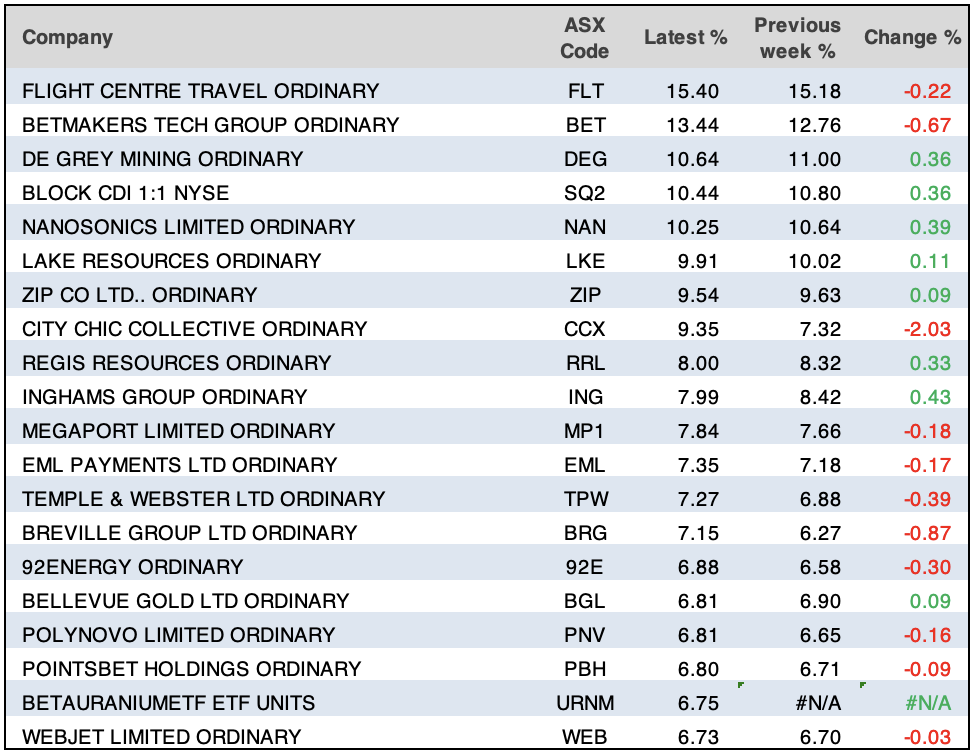
It’s been a bad week for tech, with Zip and EML kicked out of the S&P 200 index, which means ETFs will no longer be helping their share prices. Life 360 and Pointsbet also were shown the door.
According to the AFR, these companies have entered the top 200 club: Capricorn Metals, Charter Hall Social Infrastructure REIT, Johns Lyng, Karoon Energy, Lovisa, Smartgroup, Spark New Zealand and Sayona Mining.
Here are the big winners and losers of the week:
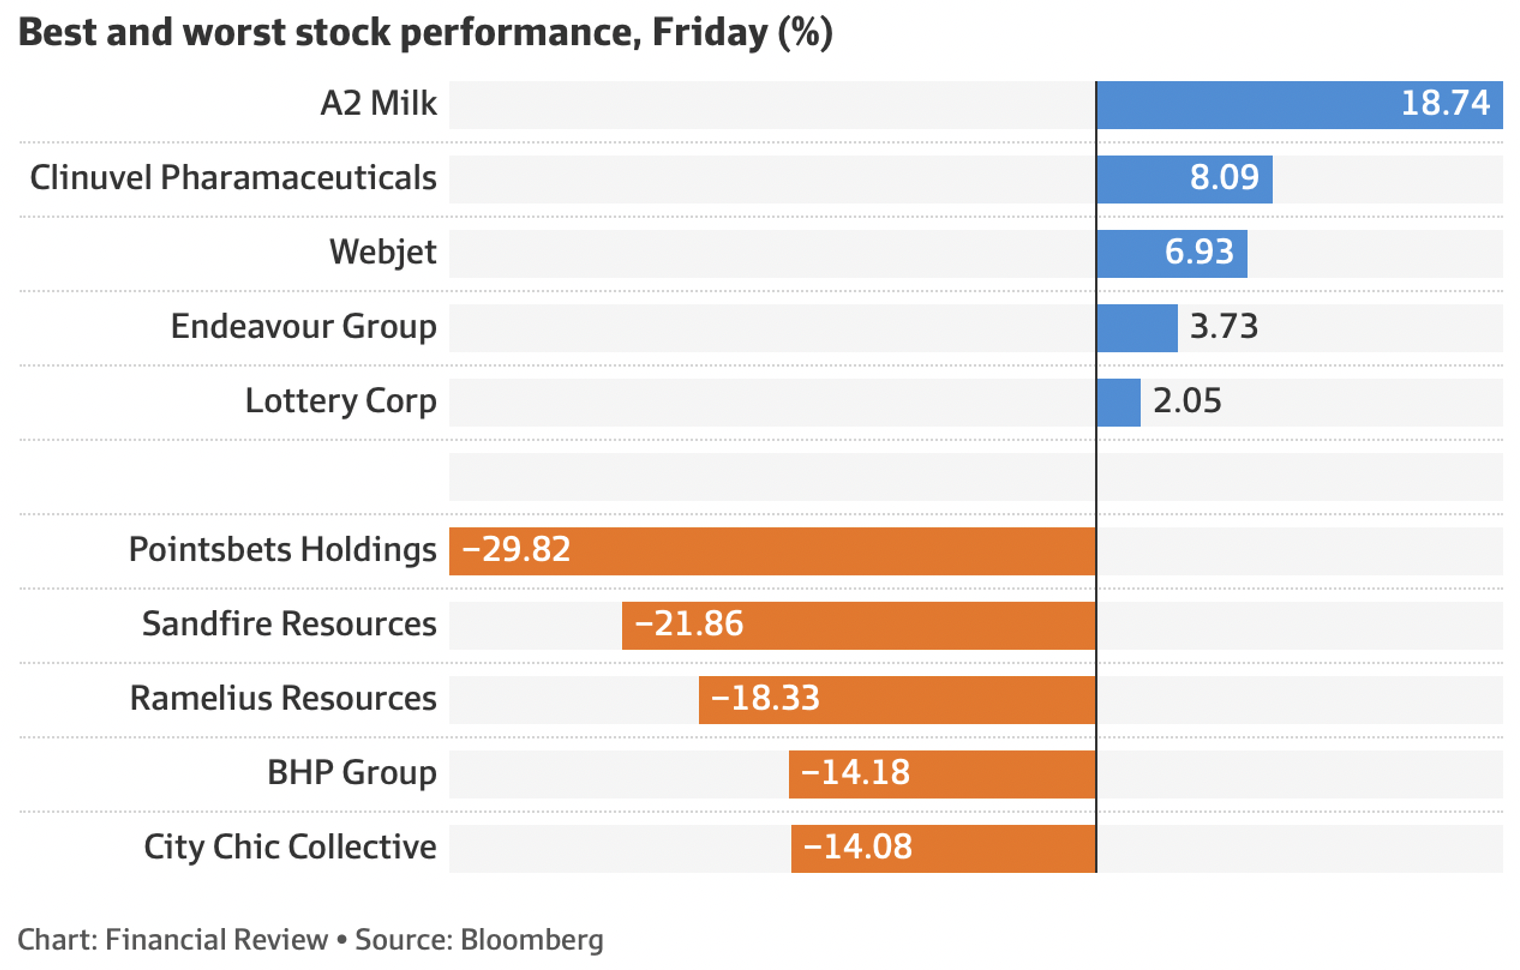
Tyro had an odd week, losing 9.68% on Friday but finished the week up 5.38% and up 13.95% for the month. It’s become a bit of a plaything for the speculators.
Ampol, Mineral Resources and TerraCom went ex-dividend on Friday, which might explain the drops in their share prices.
What I liked
- New business investment (capital expenditure) fell by 0.3% in the June quarter but was still up by 2% on the year. That’s a good slowdown reading to help reduce inflation.
- The weekly ANZ-Roy Morgan consumer confidence index fell by 0.7 to 85 points (long-run average since 1990 is 112.2 points). Consumer views on whether it is a good ‘time to buy a major household item’ dropped by 5.5% last week to a 28½-month low of -28.2 points. Another good inflation-reducing reading.
- The number of dwelling approvals fell by 17.2% in July to 13,595 units. It was the second biggest monthly percentage decline since December 2017. Approvals are down 25.9% on a year ago. Another good negative number to maybe slow down the RBA rate rises.
- The total value of new home loans fell by 8.5% in July, with loans to owner-occupiers down 7% and investor loans 11.2% lower. It was the biggest fall in the value of new home loan commitments since the beginning of the Covid-19 pandemic in May 2020. This shows the RBA’s rate rises are working
- The final S&P Global Australia Manufacturing purchasing manager’s index (PMI) fell from 55.7 in July to 53.8 in August – a 27thconsecutive month of expansion in activity. And the AiGroup manufacturing index dropped by 3.2 points to 49.3 in August, indicating a contraction in activity (reading below 50). Both readings are soft landing indicators.
- The CoreLogic Home Value Index of national home prices fell by 1.6% in August, the fourth straight monthly decline, and the biggest monthly decline in almost 40 years (since January 1983). This is what the RBA wants and it could mean fewer rate rises ahead.
- According to APRA, household deposits increased by $19.5 billion or 1.5% in July to a record $1,294.7 billion, up by 12% on a year ago. Households have accumulated $305.5 billion worth of savings since the pandemic began in February 2020. Saving instead of spending is good for reducing inflation.
- The ISM manufacturing index was unchanged at 52.8 in August (survey: 51.9). This is a good soft landing reading.
- German retail sales unexpectedly lifted 1.9% in July (survey: -0.1%).
What I didn’t like
- Over the year to June 2022, construction costs grew by 9.7% (fastest growth in 32½ years; since September 1989), with building costs up 10.9% (fastest growth in 21½ years; since September 2000) and engineering costs climbed by 8.2% (fastest growth in 13½ years; since December 2008). The only positive thing I can say about these numbers is that they ended in June and interest rate rises were in their early days.
- Commonwealth Bank (CBA) Group economists reported “CBA’s internal credit & debit card spending data to 26 August 2022 shows that spending levels remain high but the broader trend is one of moderating spending growth”. Spending needs to fall to help inflation come down.
- Eurozone inflation hit record highs of 9.1% in August.
- In Europe, there were energy concerns after Russia began shutting down gas flows to Germany via the Nord Stream 1 pipeline.
- US Consumer confidence rose from 95.3 to 103.2 in August (survey: 97.7). We don’t want the US consumer refuelling inflation!
- Job openings numbers came with an unexpected rise in July, underlining expectations of further rate hikes from the Federal Reserve.
Where are we with the stock market?
The negative types are holding the upper hand, but only just. There are a lot of optimists willing to buy on good potential news. But we need some really positive economic data to get buyers to outnumber sellers. I can’t wait until September 13!
The week in review:
- For my article [1] this week in the Switzer Report, I thought I’d look for the businesses we deal with all the time in our normal lives and try to put together a portfolio that will do better than 10%.
- While Woolworths (WOW) and Coles (COL) are major companies in their own right, Paul (Rickard) says the argument for owning both is not strong. Naturally, Paul reveals the supermarket he prefers. [2]
- Tony Featherstone looks at how to invest in a climate-changing world. To that end, he examines four index and active funds that provide diversified exposure through global equities [3].
- James Dunn shares his top 5 uranium [4]stocks given the recent bullish news for the sector.
- In our “HOT” stock column this week, Raymond Chan, Head of Asian Desk at Morgans, says that costs fail to take the shine off South32 (S32). [5] Then, Michael Gable, Managing Director of Fairmont Equities, says why he likes Yancoal (YAL). [6]
- In Buy, Hold, Sell, What the Brokers Say, there were 14 upgrades and 38 [7]downgrades in the first edition and 4 upgrades and 11 downgrades [8] in the second edition.
- And finally, in Questions of the Week, [9] Paul answers your queries about whether lithium plays are still good value; Will there be a “dot plot” when the US Federal Reserve meets next?; If you invest in the US, can you take out the currency risk?; Does Woodside offer a dividend re-investment plan and is there any discount?
Our videos of the week:
- The best cancer tip I can give you | The Check Up [10]
- Why have Tyro and A2 risen with the market smashed today? + Are JBH, Coles, Woodside & Worley buys? | Switzer Investing (Monday) [11]
- The best of Mad about Money in 2022 so far! [12]
- Shane wraps up reporting season + This expert says the Aussie property market is actually strong! | Switzer Investing (Thursday) [13]
- Boom! Doom! Zoom! | 1 September 2022 [14]
Top Stocks – how they fared:
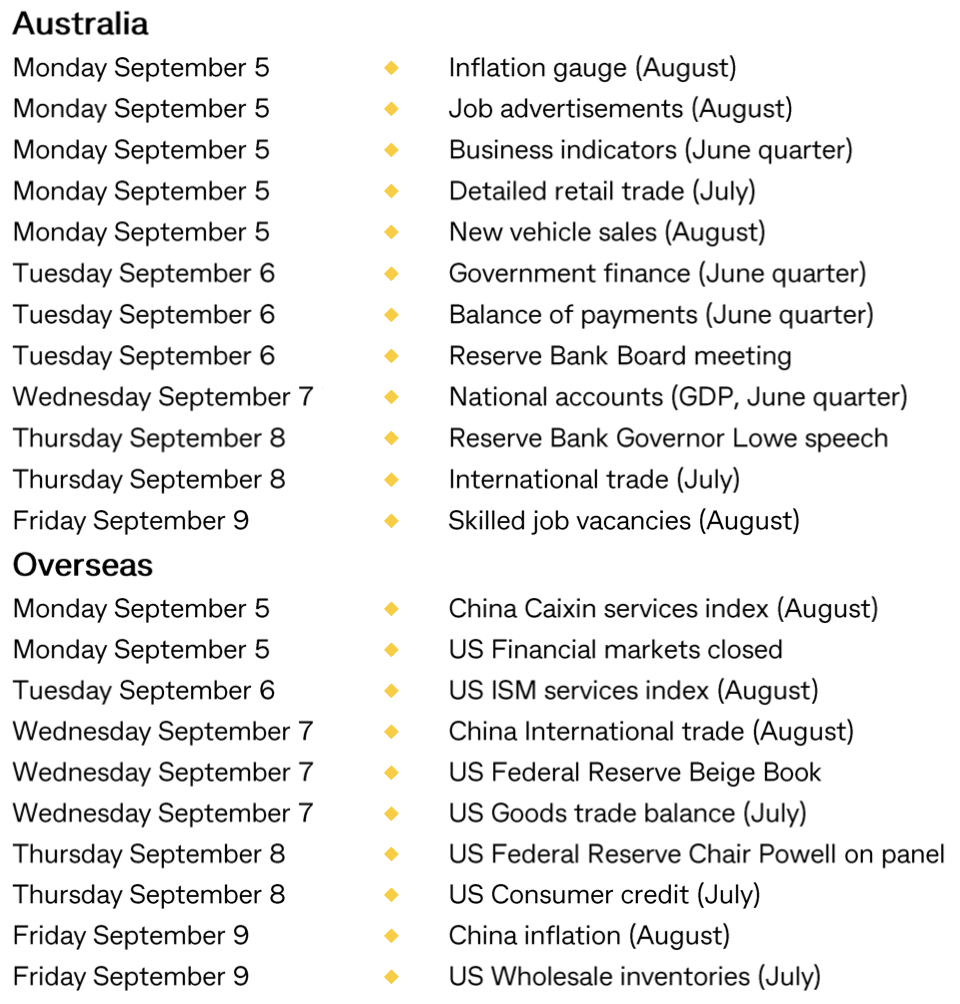
The Week Ahead:
Food for thought: “The idea that a bell rings to signal when to get into or out of the stock market is simply not credible. After nearly fifty years in this business, I don’t know anybody who has done it successfully and consistently. I don’t even know anybody who knows anybody who has.” – Jack Bogle
Stocks shorted:
ASIC releases data daily on the major short positions in the market. These are the stocks with the highest proportion of their ordinary shares that have been sold short, which could suggest investors are expecting the price to come down. The table shows how this has changed compared to the week before.
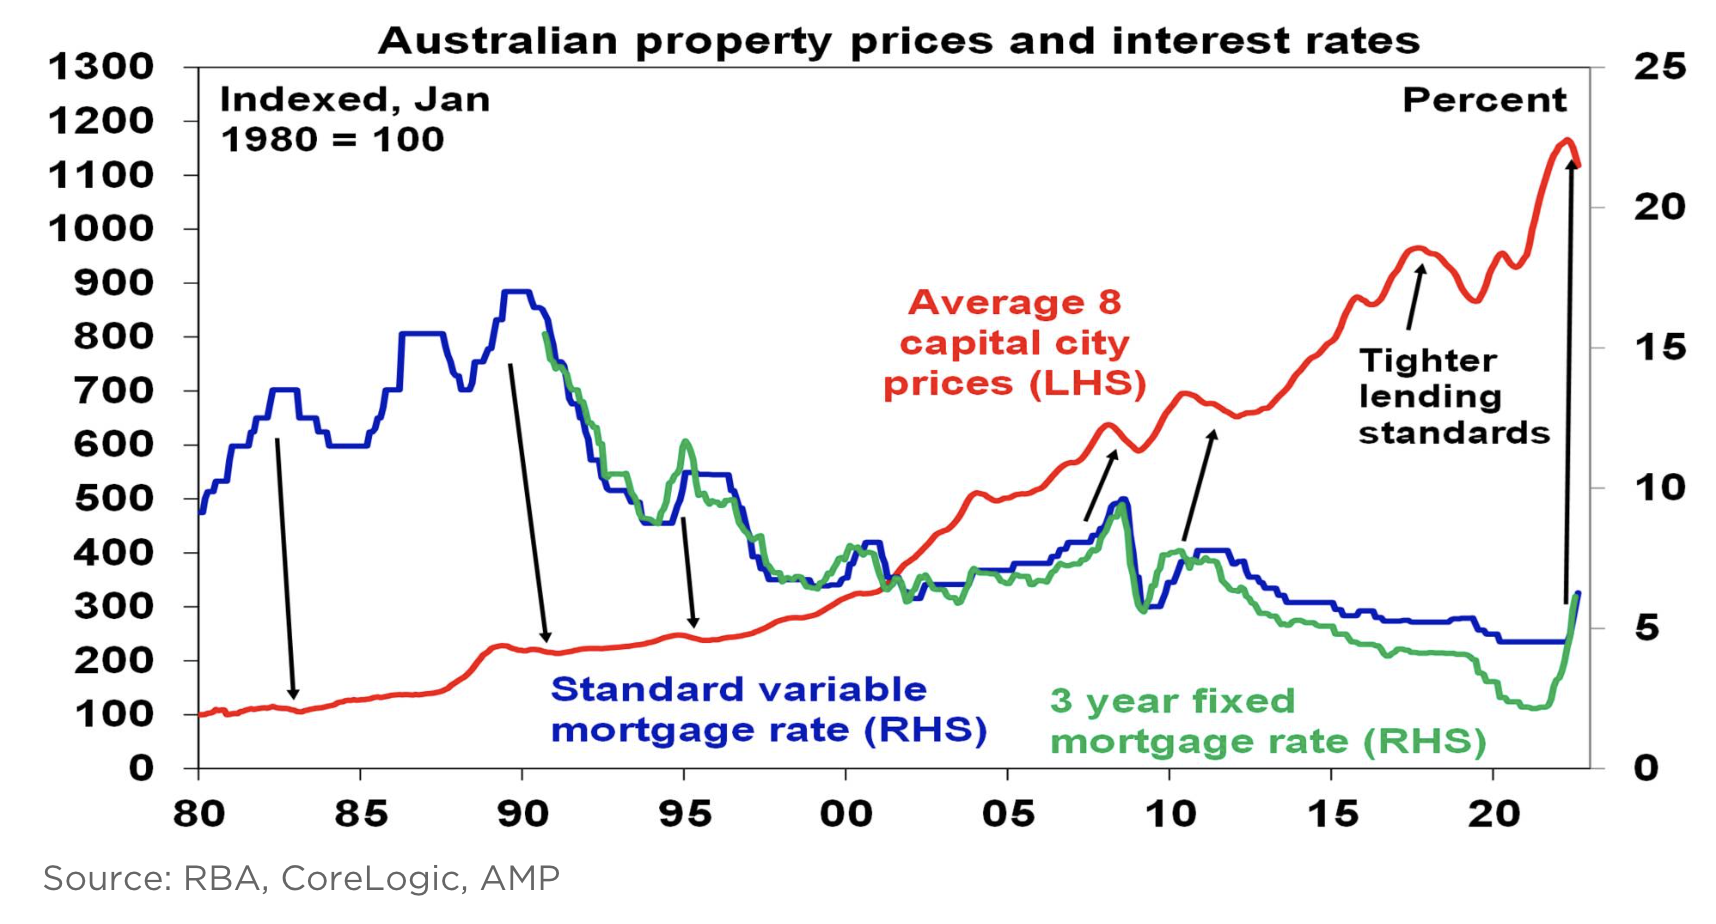
Chart of the week:
In our chart of the week, Shane Oliver of AMP Capital highlights just how stark the impact of interest rates has on our property market, both positive and negative.
Referencing the chart below, Shane says “that setbacks in home prices (highlighted with arrows) have generally been preceded by periods of rising rates (or tightening lending standards in the 2017-19 pullback). But it can also be seen that the big downswing in interest rates over the last 30 years has been associated with a long-term surge in Australian home prices as, while periods of monetary tightening drove price falls, this was quickly reversed as interest rates resumed their downtrend, seeing new record highs in home prices”.
Top 5 most clicked:
- 11 stocks I favour as good performers [15] – Peter Switzer
- Do I like Woolworths or Coles? [16] – Paul Rickard
- Buy, Hold, Sell – What the Brokers Say [17] – Rudi Filapek-Vandyck
- My top 5 uranium stocks [18] – James Dunn
- How to invest for climate change [19] – Tony Featherstone
Important: This content has been prepared without taking account of the objectives, financial situation or needs of any particular individual. It does not constitute formal advice. Consider the appropriateness of the information in regards to your circumstances.